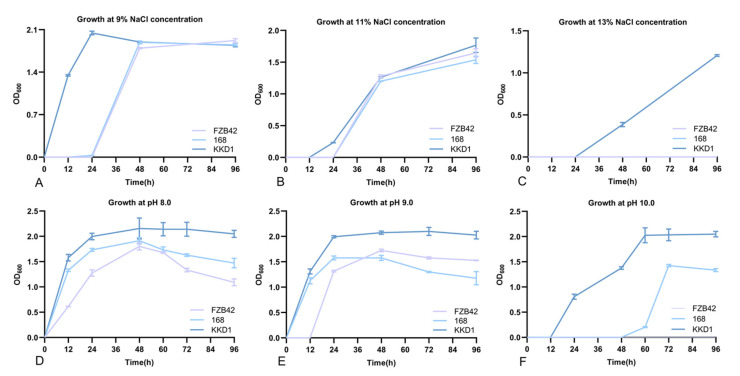
Figure 6.
Growth curve of B. halotolerans KKD1 under different stress conditions. Growth curve under salt stress (9%, 11%, 13%) and growth curve under alkaline stress (pH 8.0, pH 9.0, pH 10.0). The error bars represent the mean standard deviation of each treatment repeated three times with three replicates (A–F).

