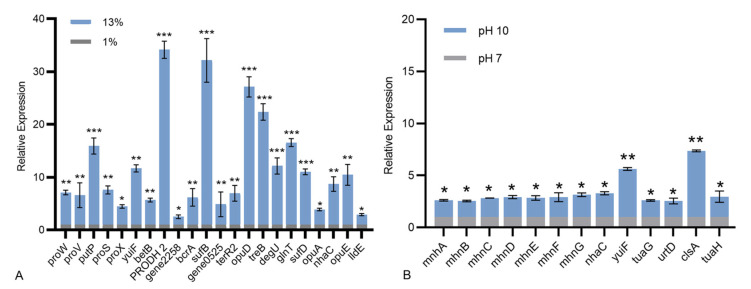
Figure 7.
Relative expression levels of different genes involved in stress resistance. (A) The relative expression levels of different genes in B. halotolerans KKD1 grown at 1% and 13% salinity. (B) The relative expression levels of different genes in B. halotolerans KKD1 grown at pH 7.0 and pH 10.0. Data are the average thickness ± the standard deviation (SD) of three independent experiments. *, indicates a significant difference (p < 0.05), **, indicates an extremely significant difference (p < 0.05), ***, indicates an extremely significant difference (p < 0.01) compared to that of control group.

