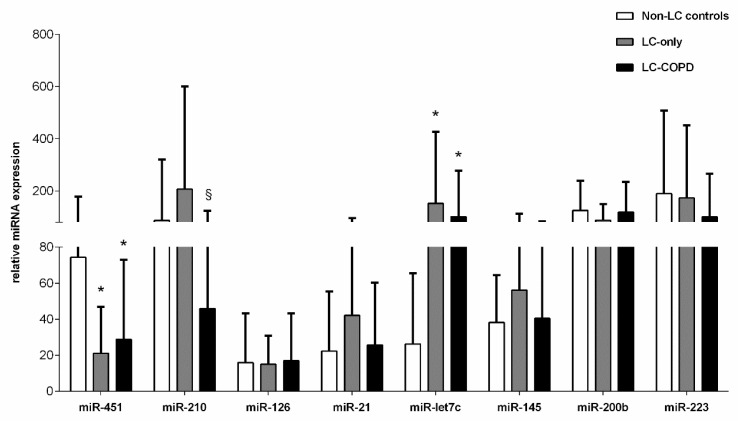
Figure 1.
Mean values and standard deviation (relative expression) of microRNA (miR) expression in plasma samples of non-LC controls (white bars), LC-only patients (grey bars), and LC-COPD patients (black bars). Statistical significance: * p < 0.05 between either of the two groups of patients with LC and the non-LC control subjects; § p < 0.05 for comparisons between LC-only patients and LC-COPD patients. For the sake of clarity, the absence of statistical symbols indicates that no significant differences were found between groups for the different study comparisons.

