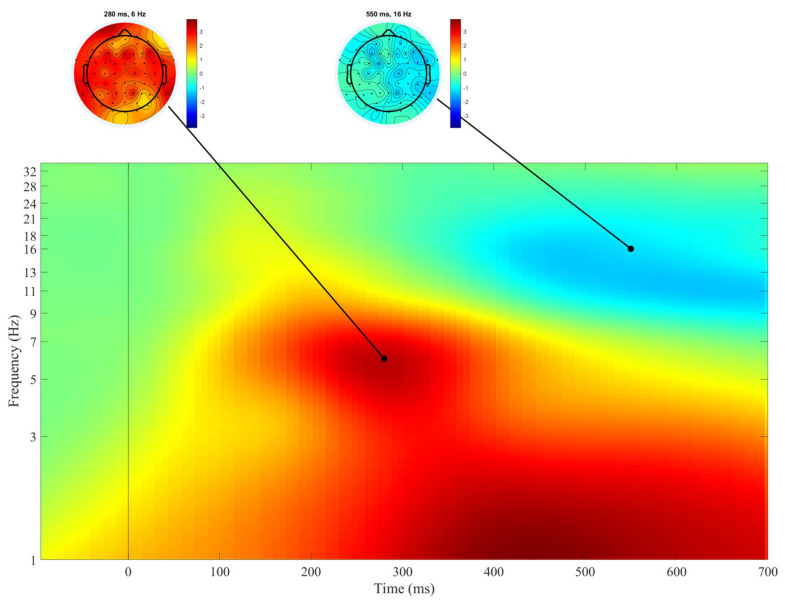
Figure 1.
Averaged event-related spectral perturbations (ERSPs) (log test–log baseline) across all electrodes and all subjects in the Go condition. The cortical distribution of the most pronounced effects is displayed by the cortical maps at the top of the figure. An increase in spectral power is illustrated by warm colors, a decrease in spectral power by cool colors. The moment when the stimulus was presented is represented by 0. n = 94.

