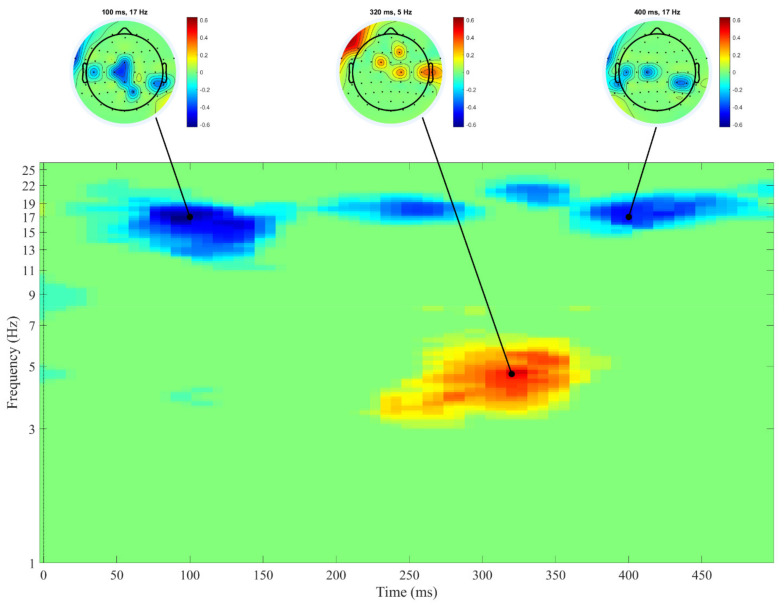
Figure 3.
Correlations between inattention scores and ERSPs after the presentation of the Go stimulus. Positive correlation coefficients are shown in warm colors, negative correlation coefficients are shown in cool colors. Darker colors correspond to stronger correlations (see vertical bars for exact values). Time-frequency areas with non-significant correlation coefficients are shown in green. The moment when the stimulus was presented is represented by 0. Heads at the top of the figure display the distribution of significant correlation coefficients in the maps of electrodes. n = 94.

