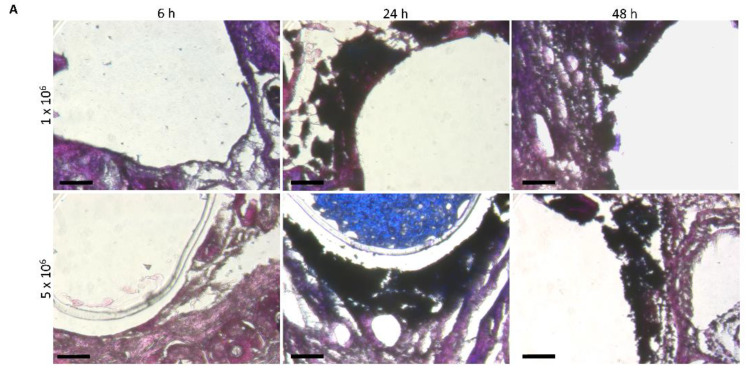
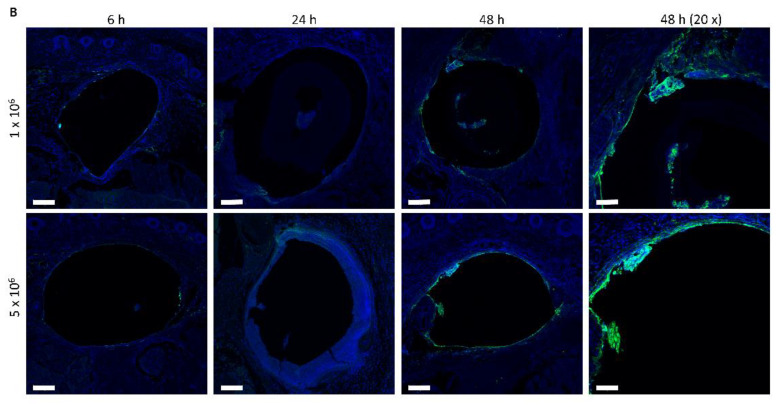
Figure 4.
(A) Visualization of bacteria at the implantation site after 6 h, 24 h and 48 h. S. aureus were stained in black via gram staining. Bars 20 µm. (B) Local endothelium apoptotic tissue damage originating from the infected implants. TUNEL staining of the implantation site after 6 h, 24 h and 48 h with 1 × 10⁶ (upper row) as well as 5 × 10⁶ (lower row) CFU (colony forming units) infected implant. Apoptotic cells stained in green and nuclei in blue via DAPI. Bars 100 µm for 10× magnification and 50 µm for 20× magnification.


