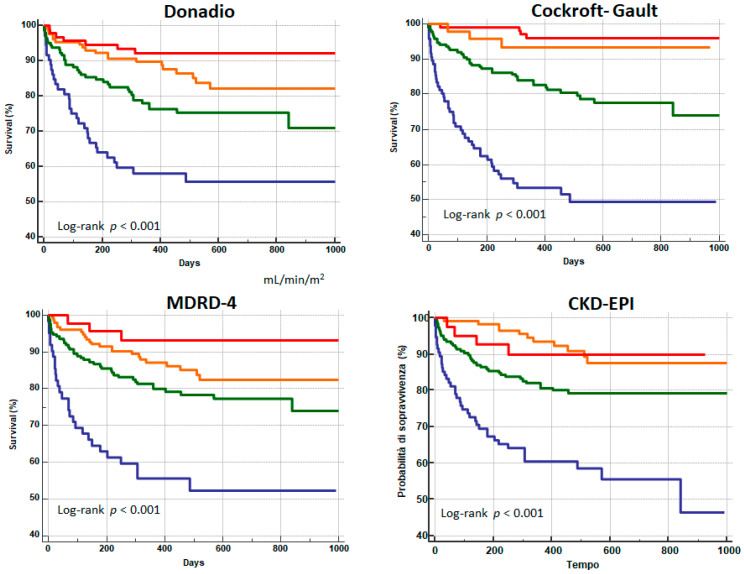
Figure 2.
Kaplan-Meier survival curves relate to each formula for estimating glomerular filtration rate (GFR) at different stages of renal function: GFR: <30 mL/min/1.73 m2 (red); GFR between 30 and 59 mL/min/1.73 m2 (orange); GFR between 60 and 90 mL/min/1.73 m2 (green); and GFR > 90 mL/min/1.73 m2 (blue). Abbreviations: CKD-EPI: Chronic Kidney Disease Epidemiology Collaboration; MDRD-4: Modification of Diet in Renal Disease Study.

