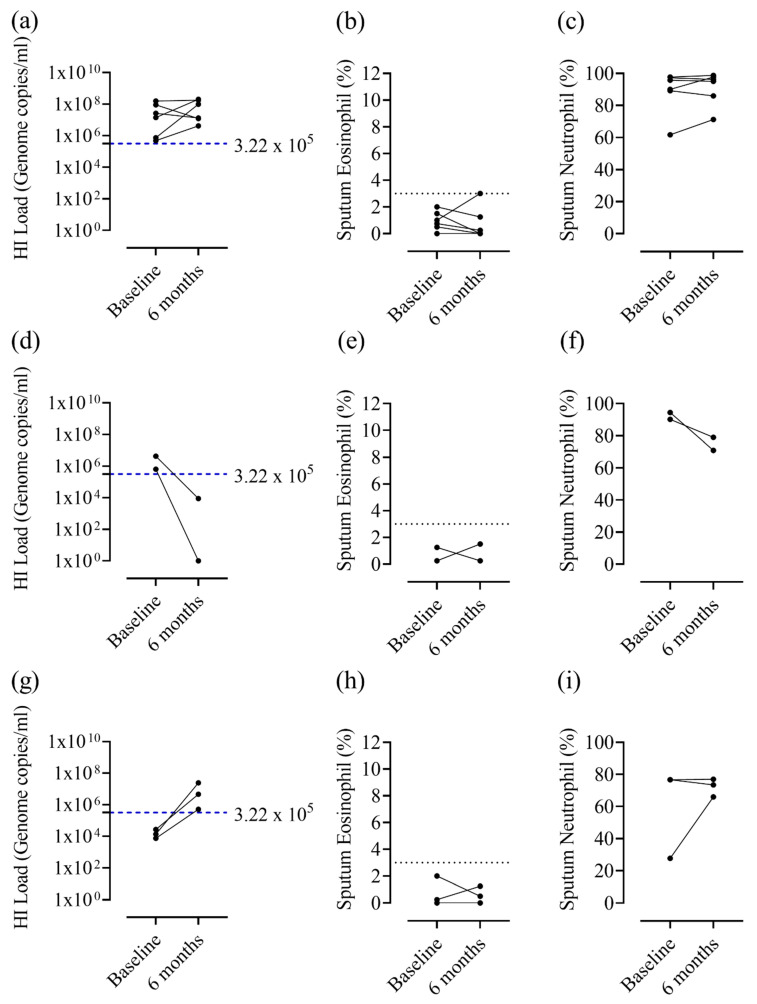
Figure 4.
Haemophilus influenzae load, sputum neutrophil percentage and eosinophil percentage at baseline and 6-month visits for patients positive for H. influenzae at one or both visits. Sputum qPCR and differential cell counts were performed to determine H. influenzae load, sputum neutrophil % and eosinophil % at baseline and 6 month visits for patients positive for H. influenzae at (a–c) both visits, (d–f) baseline only or (g–i) 6 months only. The blue dashed line represents the upper threshold of the HNS range for H. Influenzae (3.22 × 10⁵ genome copies/mL), while the black dotted line indicates 3% sputum eosinophils. HI, Haemophilus influenzae.

