Figure 6.
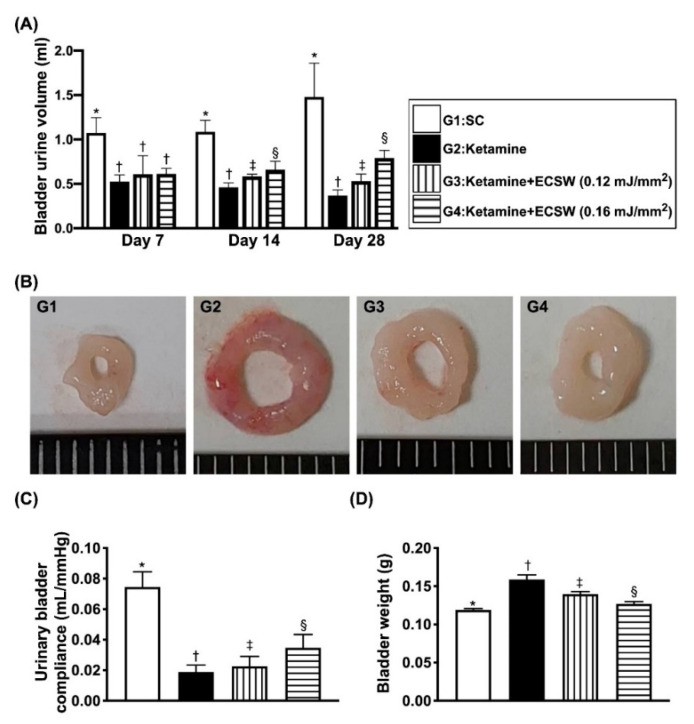
Time courses of mean maximal bladder urine volume per time interval prior to micturition (i.e., within 18 h collection of urine divided by total number of urination) and urinary bladder compliance, and the urinary bladder weight by day 42 after ketamine administration. (A) By day 7, the mean of urine volume prior to micturition, * vs. †, p < 0.001; by day 14, the mean of urine volume prior to micturition, * vs. other groups with different symbols (†, ‡, §), p < 0.0001; by day 28, the mean of urine volume prior to micturition, * vs. other groups with different symbols (†, ‡, §), p < 0.0001. (B) Illustrating the anatomical features of urinary bladder by day 42 after ketamine treatment. The appearance of urinary bladder was remarkably enlarged and swelling in G2 moreso than in G3 and G4 and more remarkably enlarged and swelling than in G1. (C) By day 28, the urinary bladder compliance, * vs. other groups with different symbols (†, ‡, §), p < 0.0001. (D) Analytical result of bladder weight, * vs. other groups with different symbols (†, ‡, §), p < 0.001. All statistical analyses were performed by one-way ANOVA, followed by Bonferroni multiple comparison post hoc test (n = 6 for each group). Symbols (*, †, ‡, §) indicate significance (at 0.05 level). ECSW = extracorporeal shock wave.

