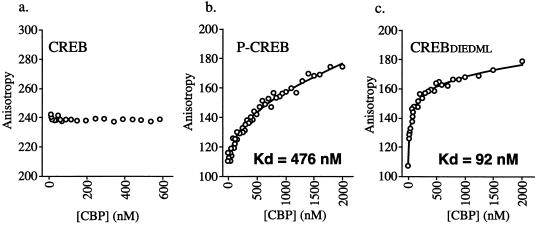
FIG. 4.
Fluorescence polarization binding curves of CBP (aa 451 to 682) for nonphosphorylated CREB-CRE (a), phosphorylated CREB-CRE (b), and CREBDIEDML-CRE (c) complexes. The change in anisotropy is plotted against the CBP protein concentration. The symbols represent the individual data points collected from successive additions of CBP to saturated CREB-CRE complexes. Each assay condition was performed in triplicate, and a representative binding curve is shown for each. No binding of CBP was detected to the complex containing nonphosphorylated CREB.

