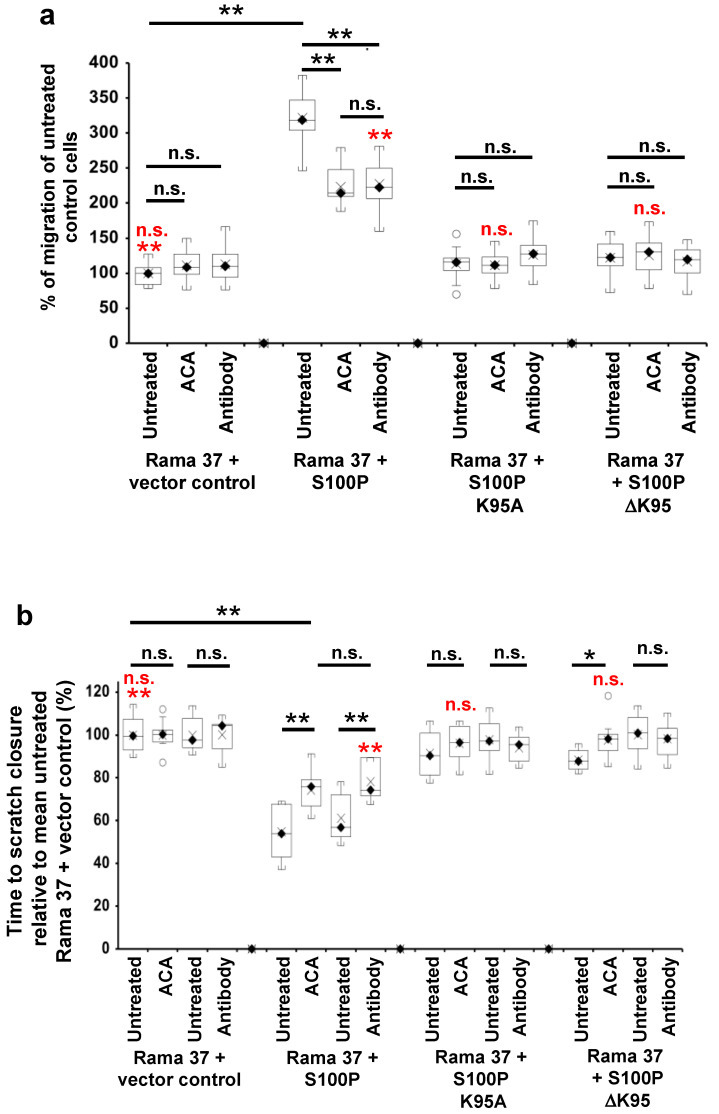
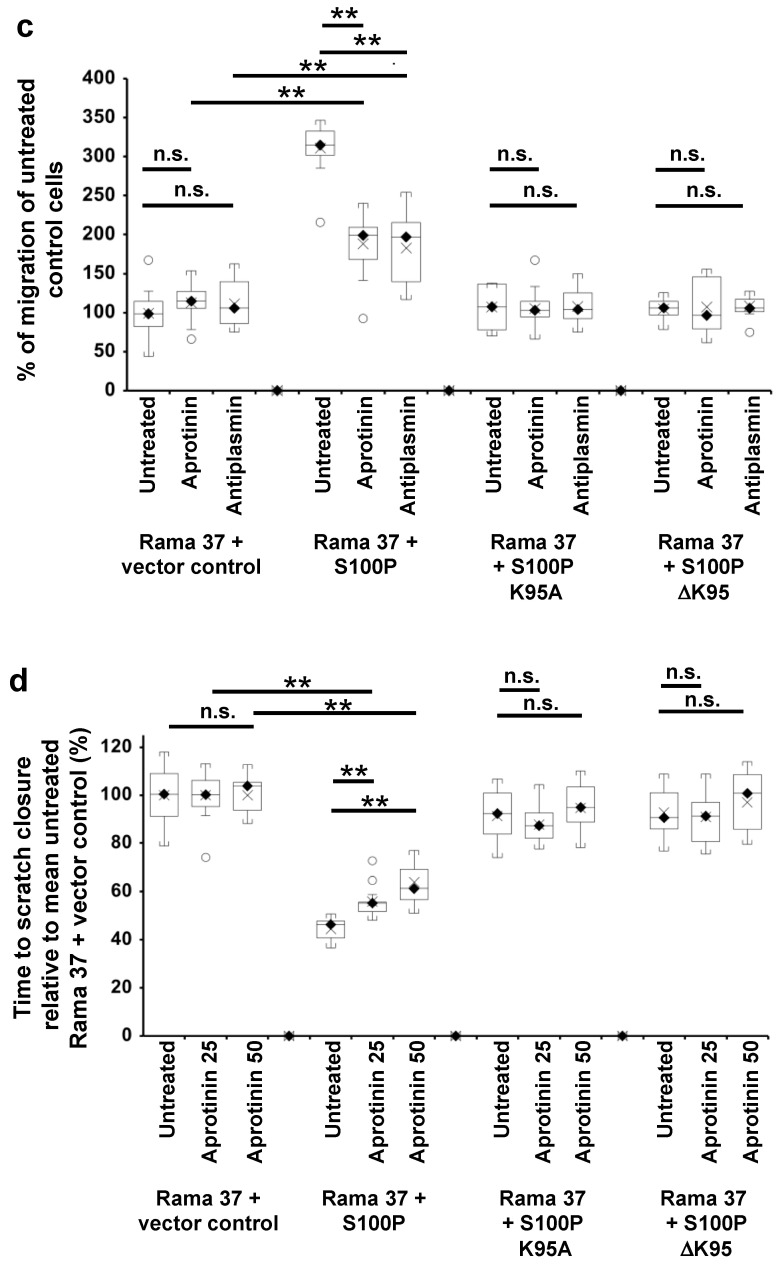
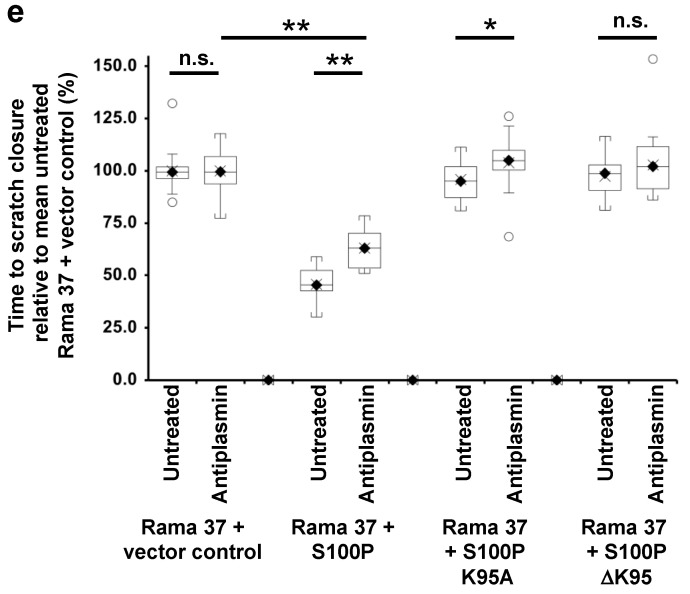
Figure 2.
Effect of 6-aminocaproic acid, S100P antibody, aprotinin, or α-2-antiplasmin on migration of cells expressing wild-type and mutant S100P proteins. Transwell migration assays (a,c) or scratch migration assays in a Cell-IQ incubator (b,d,e) were carried out as described in Materials and Methods for cells expressing wild-type S100P (Rama 37 + S100P), K95A-mutant of S100P (Rama 37 + S100P K95A), ΔK95 mutant of S100P (Rama 37 + S100P ΔK95), or cells not expressing S100P (Rama 37 + vector control). In (a,c), the number of cells passing through to the underside of the membrane in 16 h were counted and are plotted as percentages of the mean number of untreated Rama 37 + vector control cells passing through the membrane. In (b,d,e), the times to scratch-wound closure are expressed as a percentage of the mean value for untreated Rama 37 + vector control cells. The effect on migration of cells of addition to the extracellular medium (upper and lower chambers in the case of Transwell assays) of 10 mM 6-aminocaproic acid (ACA, panels a,b) or of an R&D Systems polyclonal goat S100P-specific antibody (Cat No. AF2957) at a concentration of 0.2 ng/μL in the medium (Antibody, panels a,b) are shown. Each box and whisker plot shows the dispersion of data from 14 (a) or 11–12 (b) wells in two independent experiments carried out at different times. (c) Effect on Transwell migration of 50 μg/mL aprotinin (Aprotinin) or 10 μg/mL α-2-antiplasmin (Antiplasmin) in the extracellular medium. (d) Effect on scratch-wound migration of 25 μg/mL aprotinin (Aprotinin 25) or 50 μg/mL aprotinin (Aprotinin 50) in the extracellular medium. (e) Effect of 10 μg/mL α-2-antiplasmin (Antiplasmin) on scratch-wound migration. Each box and whisker plot shows the dispersion of data from 14 (c) or 14–25 wells (d,e) in two independent experiments carried out at different times. In all panels, p-values are indicated for comparison between the box and whisker plots beneath the ends of the horizontal lines as not significant (n.s., p > 0.05), or significant * (p between 0.001 and 0.05) or ** (p < 0.0001). For clarity, some p-value comparisons are shown without lines and in red colour, as follows: (a), n.s., Transwell assay Rama 37 + S100P K95A or Rama 37 +ΔK95 in the presence of 6-aminocaproic acid not significantly different from vector control (Dunnett post-hoc multiple comparison with a control); ** Rama 37 +S100P antibody significantly faster than Rama 37 + vector control, p < 0.0001; (b), scratch-wound assay, n.s. Rama 37 + S100P K95A or Rama 37 + ΔK95 in the presence of 6-aminocaproic acid not significantly different from vector control; ** Rama 37 +S100P antibody significantly faster than Rama 37 + vector control (p < 0.0001). In all boxes, the black diamond and line show the median value; the cross shows the mean value. The white circles outside the whiskers denote outliers of >1.5 times the interquartile range.


