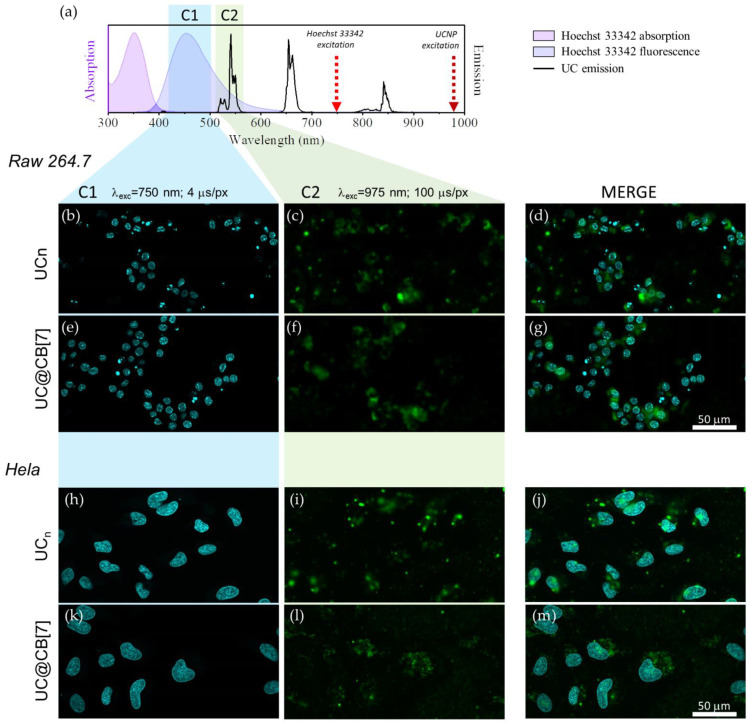
Figure 6.
(a) Absorption (pink area) and fluorescence (purple area) of Hoechst 33342, emission of UCn dispersion in DMSO (black line) together with the wavelength used to excite the dye/UCNP (arrows) and the microscope detection channels (coloured rectangles). (b–g) microscope images of RAW 264.7 cells exposed to UCn and UC@CB[7]. (h–m) microscope images of HeLa cells exposed to UCn and UC@CB[7]. Left column shows the fluorescence signal of Hoechst 33342 (λex = 750 nm, dwell time: 4 μs/pixel, detection channel: C1) central column shows the 520/540 nm Er3+ upconversion emission (λex = 975 nm, dwell time: 100 μs/pixel, detection channel: C2) and right column is a composite of the in line previous images. 50 μm scale bar applies for all images.

