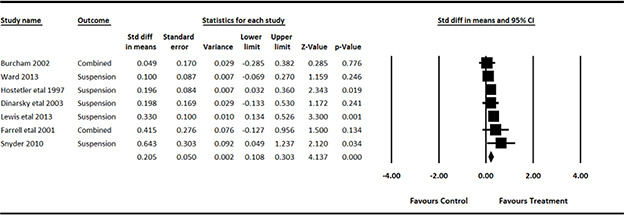
Figure 5.

Forest plot of the effect sizes for the impact of school‐based programmes on school exclusion: post‐treatment (seven studies only)

Forest plot of the effect sizes for the impact of school‐based programmes on school exclusion: post‐treatment (seven studies only)