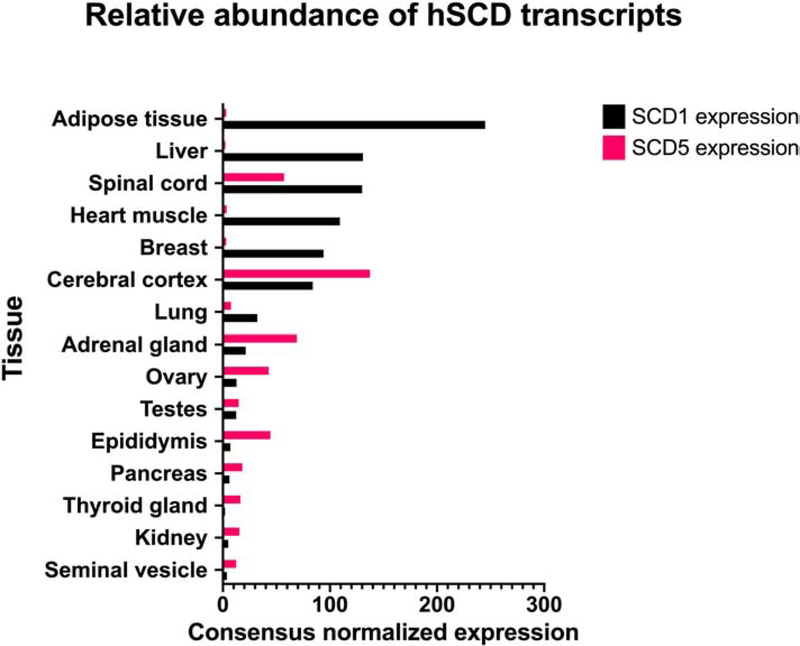
Figure 3. Expression of human SCD1 and SCD5 in tissues.
Relative expression of SCD1 and SCD5 in several human tissues (adapted from Human Protein Atlas, www.proteinatlas.org). Data represented in graph is based on RNA-seq data from Human Protein Atlas and the Genotype-Tissue Expression project, as well as CAGE data from FANTOM5 project.

