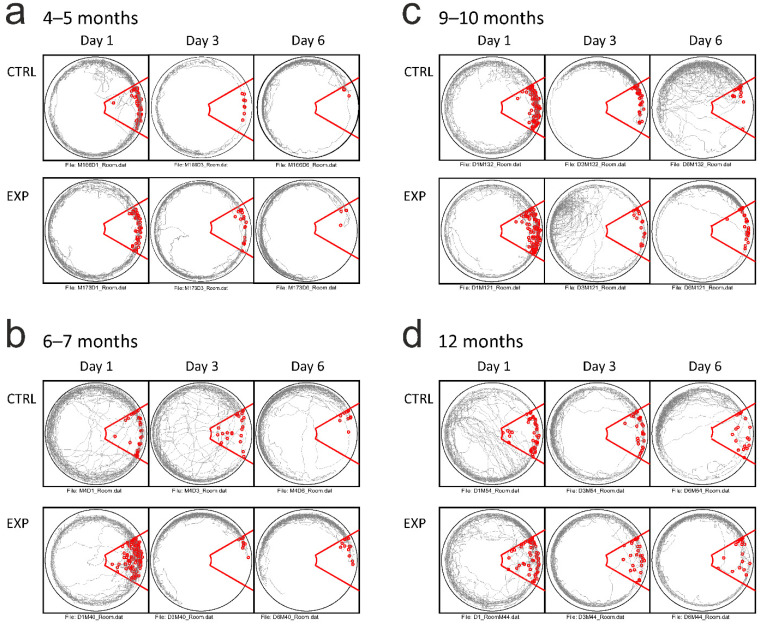
Figure 3.
Examples AAPA tracks (grey line) from pairs of experimental and control animals across days 1, 3 and 6 from all age groups. The tracks are depicted in the room coordinate frame. As in Figure 1d, the red line indicates the boundaries of the punished area, with red circles marking the individual footshock’s delivery. Note the evolution of an avoidance behaviour during the course of the training across all age groups: (a) 4–5 months, (b) 6–7 months, (c) 9–10 months and (d) 12 months.

