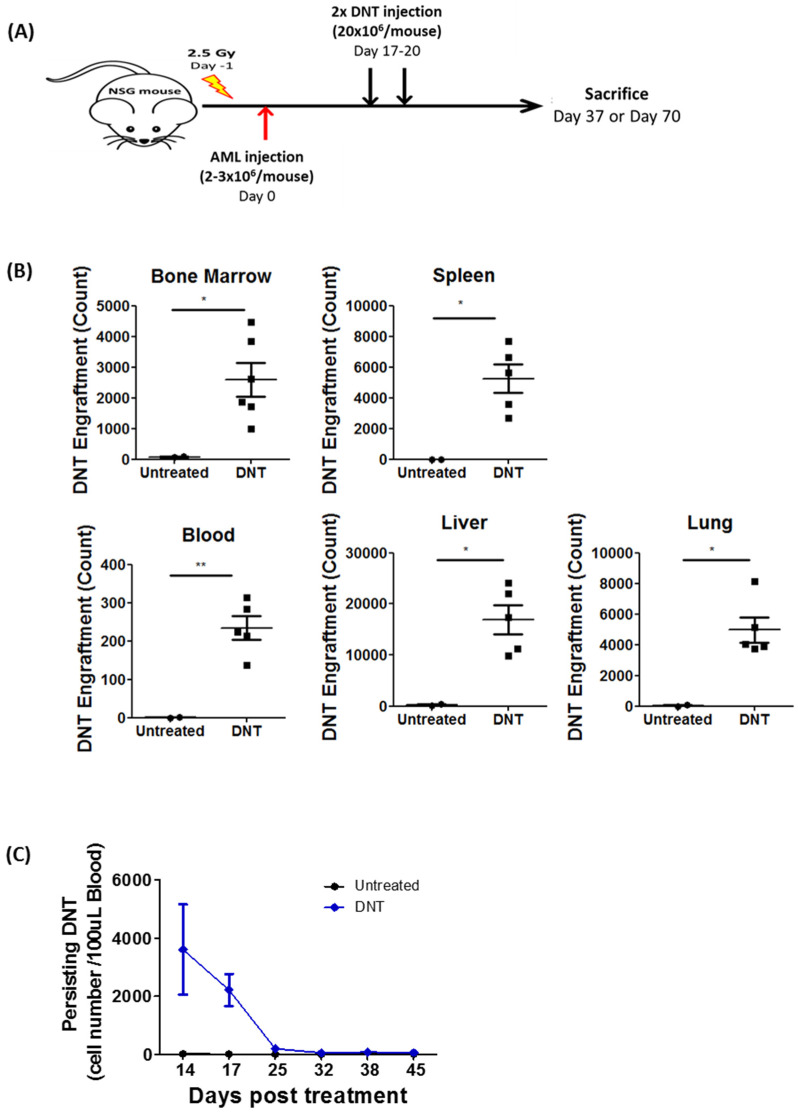
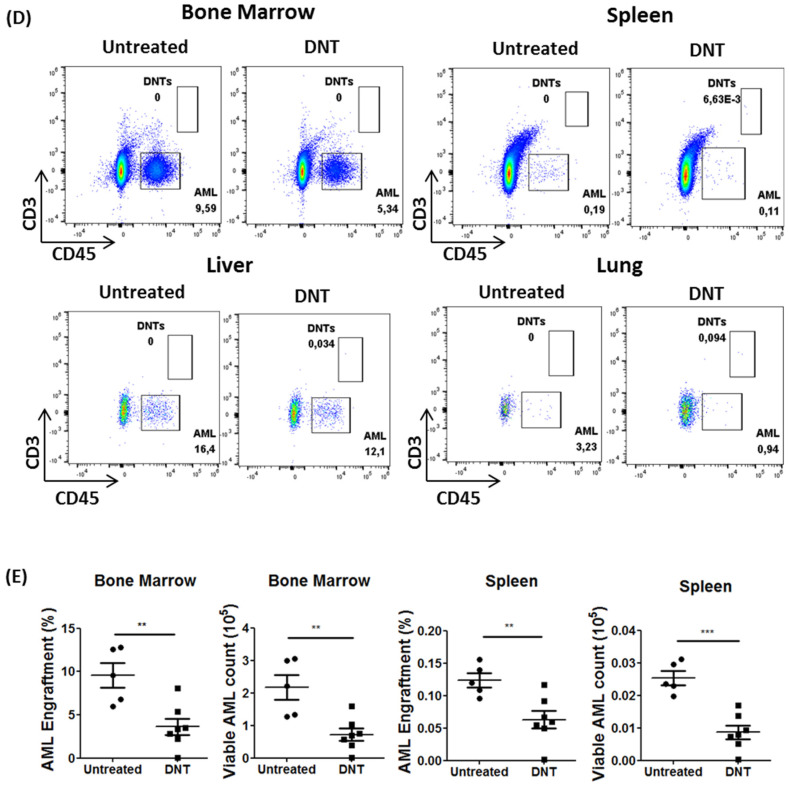
Figure 1.
DNT persistence and anti-leukemic activity in leukemia-bearing hosts. (A) Schematic diagram of patient-derived xenograft model used. Sublethally irradiated NSG mice were infused with 2–3 × 10⁶ primary AML patient sample on day 0. On day 17 and 20, mice were infused with 2 × 10⁷ DNTs. Mice were sacrificed, and DNT and AML engraftment were assessed in various tissues on day 37 or day 70. (B,C) NSG mice engrafted with a primary AML sample (090543) were treated with PBS or DNT as described in (A). (B) Number of viable DNTs engrafted in the bone marrow, spleen, blood, liver, and lung were assessed on day 37, which was 17 days post DNT infusion. (C) Number of DNTs detected in mice peripheral blood from day 14 to 45 days post DNT infusion. Each symbol represents individual mice, and error bars represent SEM. (D,E) NSG mice engrafted with a primary AML sample (130624) were treated with PBS or DNT as described in above. Mice were sacrificed and DNT and AML engraftment were assessed in various tissues on day 70, which was 50 days post-treatment. (D) Representative flow plots showing AML engraftment (CD45low+ CD3−) and DNT engraftment (CD45high+ CD3+) from untreated and DNT treated groups. (E) Dot plot shows frequency and number of viable AML cells in untreated (n = 5) and DNT-treated (n = 7) mice bone marrow and spleen. Each symbol represents individual mice, the horizontal bars represent the mean, and the error bars represent SEM. The result is representative of two similar experiments with different AML primary blasts. * p < 0.05, ** p < 0.01, *** p < 0.001.


