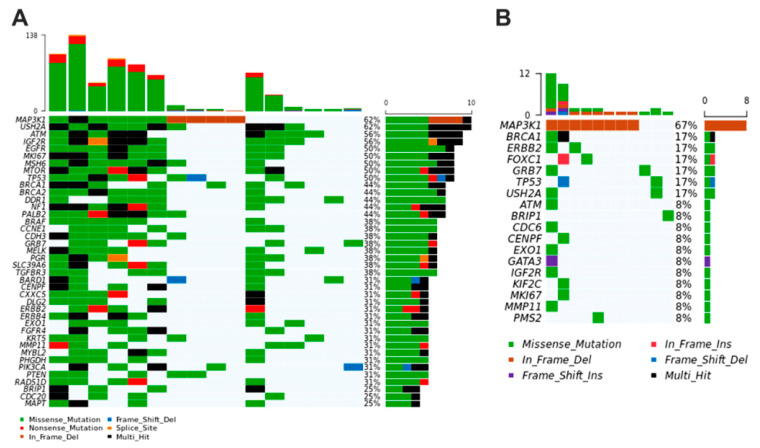
Figure 6.
Oncoplots depicting the distribution of most representative variants in BC-associated genes regarding the individual tumor fragments (A) and plasma samples (B) of women. The upper plot shows the frequency of mutation for each tumor sample and lower left plots exhibit the mutations in each tumor sample (most deleterious mutation types are shown). The lower right plots indicate the frequency of samples mutated in fragments and plasma of patients. Graphics were generated from the R language, using the Maftools package.

