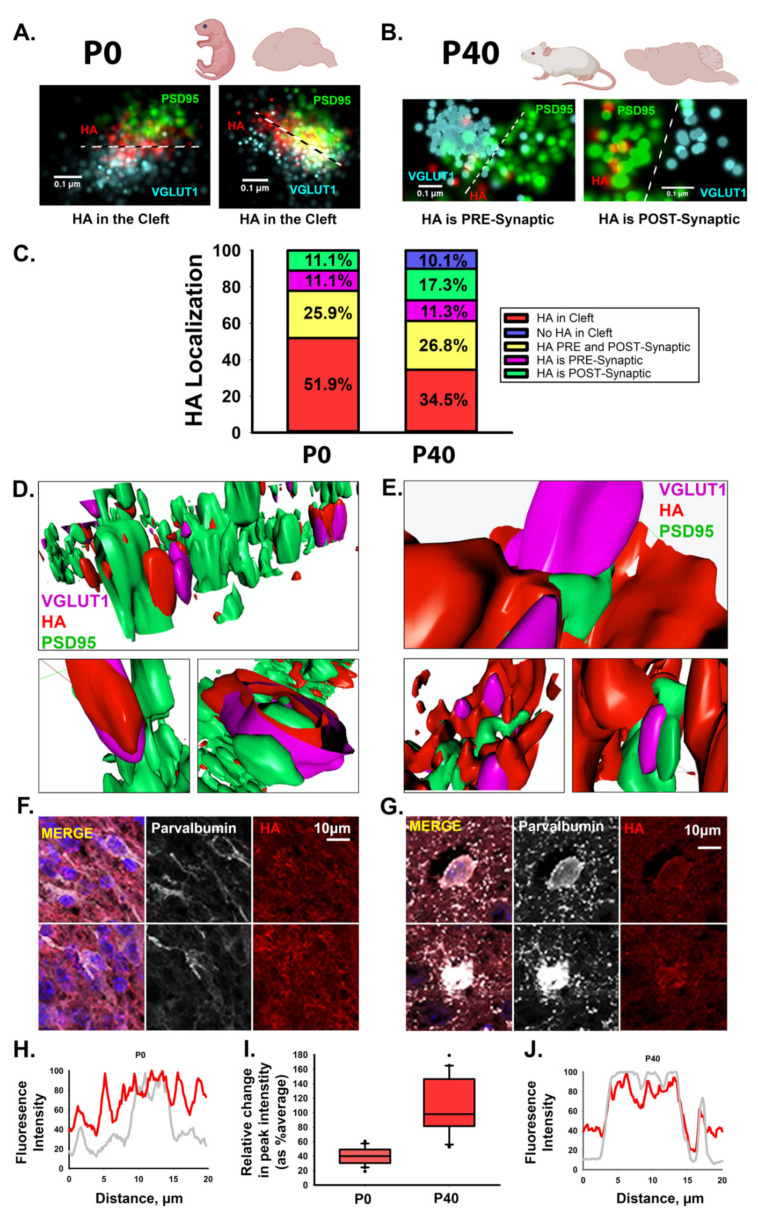
Figure 1.
Hyaluronan exhibits a dynamic developmental expression at excitatory synapses. (A) Representative dSTORM images of HA within the synaptic cleft between excitatory synaptic markers, VGLUT1 and PSD95, in mouse P0 cortical slices. Cyan: pre-synaptic marker VGLUT1; green: post-synaptic marker PSD95; red: HA. (B) Representative dSTORM images of HA outside of the synaptic cleft, yet near synapses, in P40 mouse cortical slices. (C) To illustrate the shift in HA localization from P0 to P40 we used percent stacked bar charts to look at the distribution of HA localization at excitatory synapses visualized by dSTORM microscopy. Percentages are based on the distance from HA to each synaptic marker. HA in the cleft between pre- and post- synaptic is shown in red. HA near (within 100 nm) of the pre- and post-synaptic marker is labeled as HA localized to both the pre- and post-synaptic compartment (yellow). HA preferentially localizing to one synaptic compartment is labeled as HA localized to either the pre- or post- synaptic compartment (presynaptic: magenta; postsynaptic: green). Synapses lacking HA are labeled in blue. n = 168 synapses from 4 brain samples for each P0 or P40 time point. (D,E). Three-dimensional reconstruction of mouse excitatory synapses using Airyscan processing reveals that HA is clearly present between synaptic markers on postnatal day 1 (P0) (D) but shifts to surround excitatory synapses at P40 (E). (F–J) Inhibitory interneurons in P0 (F) and P40 (G) mouse cortical brain slices, stained for DAPI in blue, parvalbumin (inhibitory interneurons) in white, and HA in red. While HA is ubiquitous around the cells at P0, condensed perineuronal nets are absent. By contrast, HA is found in the form of a visibly condensed perineuronal net around the soma at P40.

