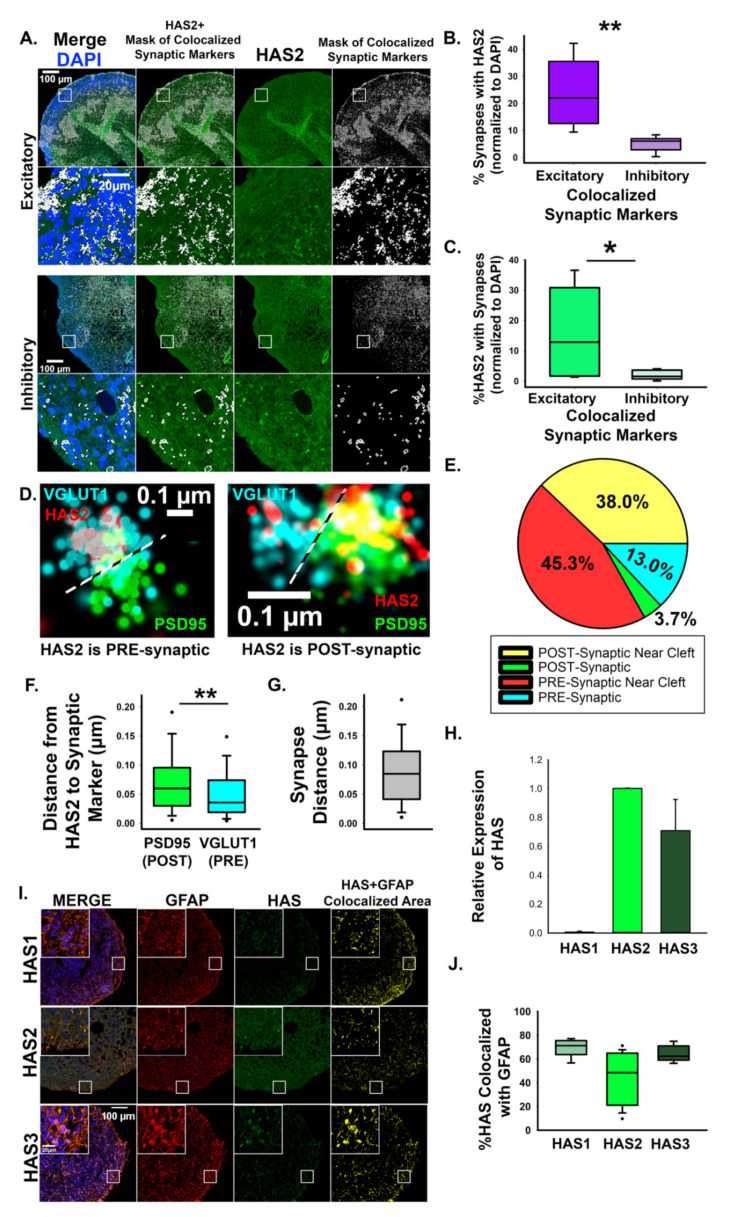
Figure 2.
Hyaluronan synthase, HAS2, localizes to excitatory synapses. (A) Representative confocal images of HAS2 together with colocalized excitatory synapse markers, VGLUT1 and PSD-95, and colocalized inhibitory synapse markers, VGAT and gephyrin. Panels show DAPI (blue), HAS2 (green) and a mask of colocalized synaptic markers (white). Co-localization analysis between HAS2 and the area defined by the colocalized synapse mask reveals that HA is preferentially enriched at excitatory synapses. (B,C) Quantification of HAS2 synaptic localization shown in A. n = 9 total spheroids derived from 3 separately grown spheroid sets for each set of synaptic markers. * p = 0.027 ** p < 0.001. (D) dSTORM imaging reveals that HAS2 localizes to pre- and post-synaptic compartments of excitatory synapses. The pre-synaptic marker VGLUT1 is shown in blue, HAS2 is shown in red, and post-synaptic PSD95 is shown in green. (E) Pie chart showing preferred synaptic localization of HAS2. Within 100 nm of the synaptic cleft is distinguished as ‘near cleft’. (F) Quantification of the average distance between HAS2 and synaptic markers. n = 168 synapses from 9 total spheroids derived from 3 separately grown spheroid sets, ** p < 0.001. (G) Quantification of the average distance from pre- (VGLUT1) to post-synaptic (PSD95) markers demonstrates that HAS2 is closer to the cleft at the pre-synaptic VGLUT1-postive compartments. (H) qRT-PCR relative mRNA expression of HAS1 and HAS3 as compared to HAS2. (I) Representative images of cortical spheroids stained for HAS isoforms (green), GFAP (red), and DAPI. Far right panel (yellow) is the area of colocalization between HAS and GFAP. Scale bar 100 µm, inset: 20 µm. (J) Quantification of HAS and GFAP colocalization.

