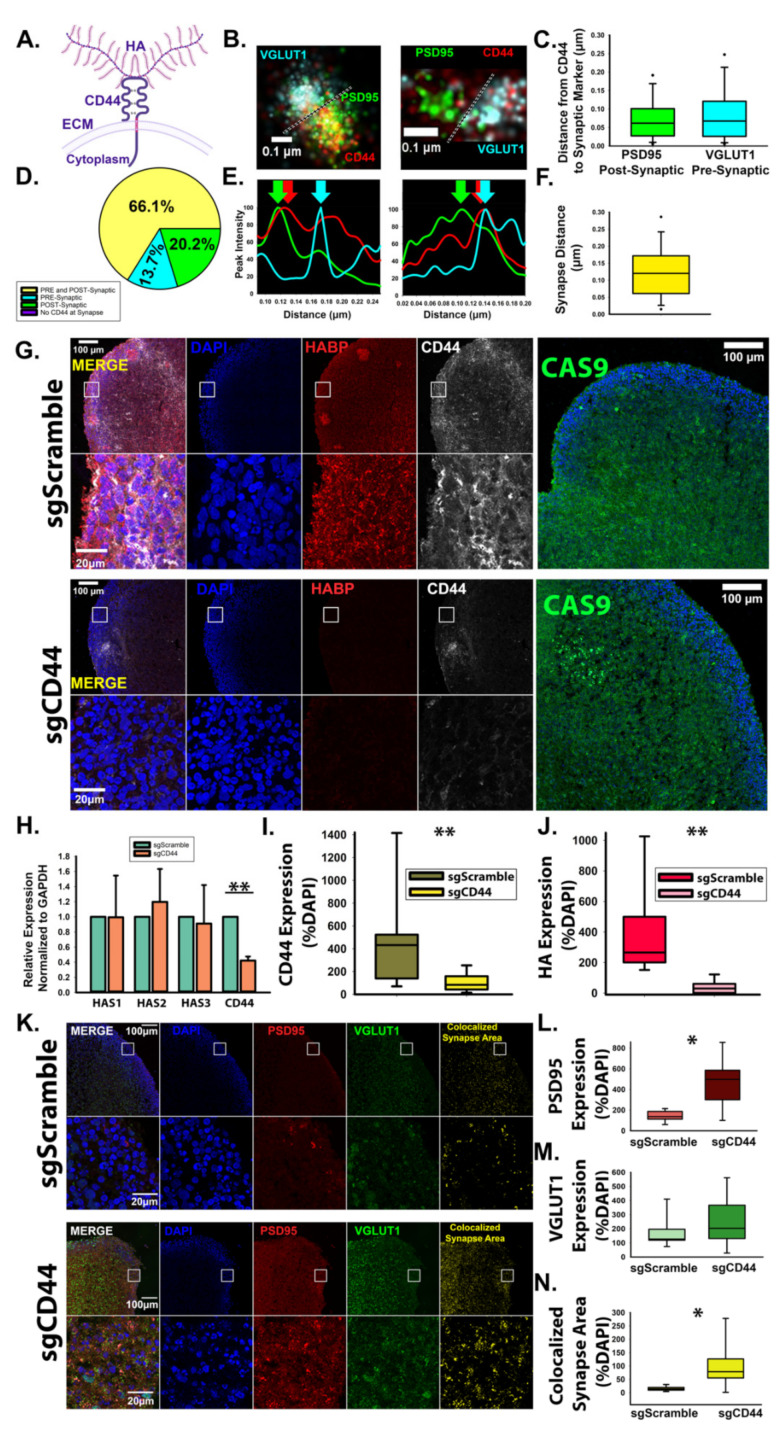
Figure 6.
CD44 localizes to excitatory synapses and promotes HA retention in developing neural circuits. (A) Schematic of transmembrane protein CD44 bound to HA. (B) Representative dSTORM images of CD44 at excitatory synapses demonstrates that CD44 localizes to both pre- and post-synaptic compartments. Green: PSD95; red: CD44; cyan: VGLUT1. (C) Quantified distance from CD44 to pre- and post-synaptic markers. n = 168 synapses from 9 total spheroids derived from 3 separately grown spheroid sets. (D) Quantification of CD44 localization at individual excitatory synapses reveals that in the majority of cases, CD44 localizes to both the pre- and post-synaptic compartment (yellow) but may also be found solely within the pre- synaptic (blue) or post-synaptic (green) compartment. (E) Synaptic intensity plot profiles corresponding to the synapses shown in B. Arrow indicate the peak intensity of PSD95, VGLUT1, and CD44 at the synapse. (F) Quantification of the synaptic distance between VGLUT1 and PSD95. n = 168 synapses from 9 total spheroids derived from 3 separately grown and transduced spheroid sets. (G) Representative images of cortical spheroids stably expressing dCas9-KRAB (green) for CRISPR-mediated interference of gene expression. At day 90, dCAS9-KRAB-expressing cortical spheroids were lentivirally transduced with either non- targeting scrambled sgRNA or sgRNA directed toward the promoter region of CD44. After 48 h, spheroids were fixed and stained for DAPI (blue), HABP (red) and CD44 (white). (H) qRT- PCR confirmation of CD44 knockdown. n = 9 total spheroids for each sgScramble and sgCD44 derived from 3 separately grown and transduced spheroid sets ** ≤ 0.001. (I) Quantification of area of CD44 expression normalized to the area of DAPI. n = 18 ** p < 0.001. (J) Quantification of area of HABP expression normalized to DAPI area. n = 9 total spheroids for each sgScramble and sgCD44 derived from 3 separately grown and transduced spheroid sets ** p < 0.001. (K) Representative images of cortical spheroids stained for excitatory synaptic markers, PSD95 and VGLUT1, and DAPI. Far right panel: colocalized synaptic area. (L) Quantification of PSD95 expression normalized to DAPI. * p < 0.05. (M) Quantification of VGLUT1 expression normalized to DAPI. (N) Quantification of colocalized excitatory synapse area normalized to DAPI, * p < 0.05.

