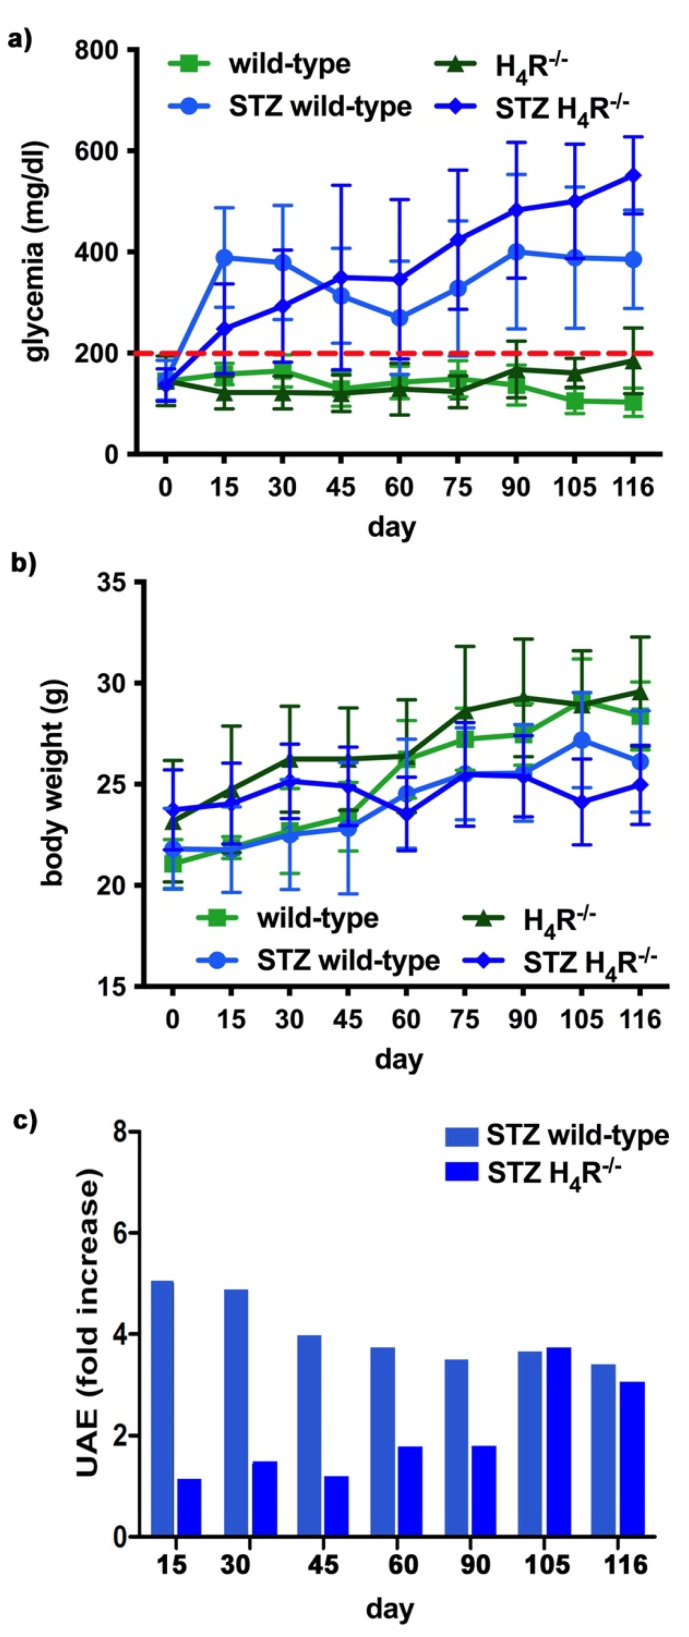
Figure 4.
Comparison of diabetic wild-type and H4R−/− mice: (a) Six-hour fasting blood glucose was recorded fortnightly using a Glucocard MX Blood Glucose Meter. Data are expressed as mean ± S.E.M. The red line identifies the 200 mg/dL fasting blood glucose level cut used to assess the diabetes onset; (b) Body weight was monitored and recorded constantly throughout the experimental period. Data are expressed as mean ± S.E.M.; (c) Albuminuria progression was monitored over time on urine samples collected over 24 h. The data are expressed as fold increases compared to the relatively healthy controls. UAE = albuminuria.

