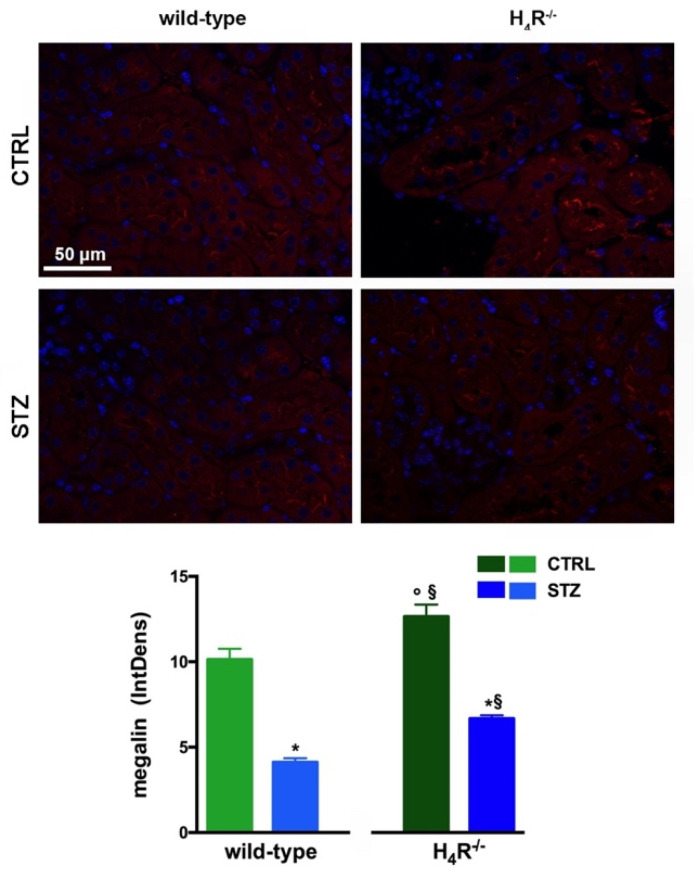
Figure 5.
Comparison of megalin expression between wild-type and H4R−/− mice. Micrographs at 40× magnification showing the immunofluorescence analysis of megalin (red). Nuclei were stained with DAPI (blue). Densitometric analysis of megalin expression was determined by immunofluorescence analysis. Expression levels over control are expressed as the mean (IntDen) ± S.E.M. (n = 10); * p < 0.05 vs. wild-type; § p < 0.05 vs. STZ wild-type; ° p < 0.05 STZ H4R−/− vs. H4R−/−.

