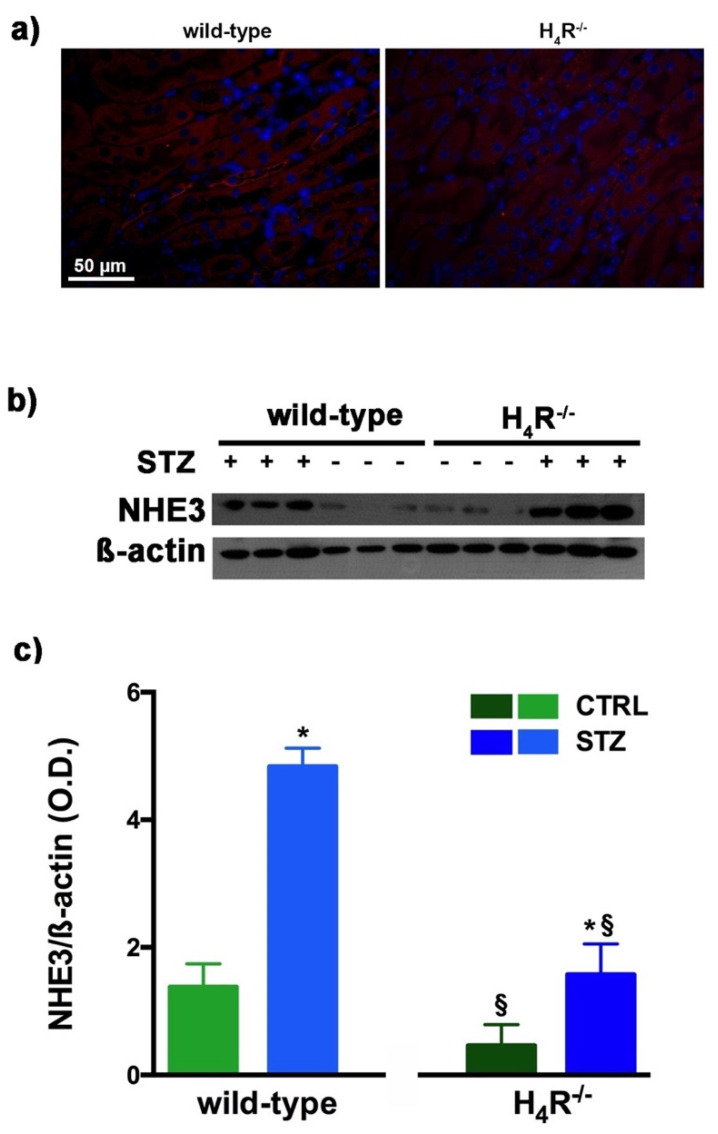
Figure 6.
Comparison of NHE3 expression between wild-type and H4R−/− mice. Micrographs at 40× magnification showing the immunofluorescence analysis of NHE3 (red). Nuclei were stained with DAPI (blue) (a); Representative radiograph of NHE3 in kidney tissue determined by immunoblotting (b); The densitometric analysis (c) was performed, and expression levels normalized to β-actin are expressed as the mean ± S.E.M. of 3 animals/group; * p < 0.05 vs. wild-type; § p < 0.05 vs. STZ wild-type.

