Scheme 1.
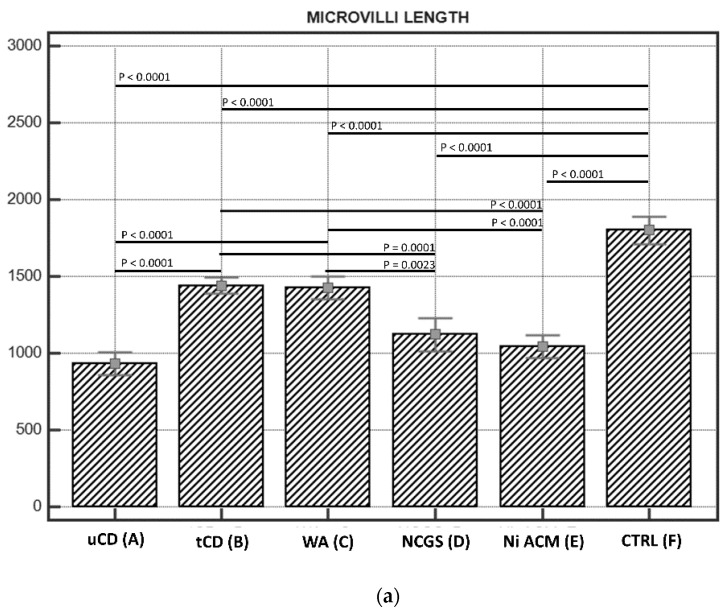
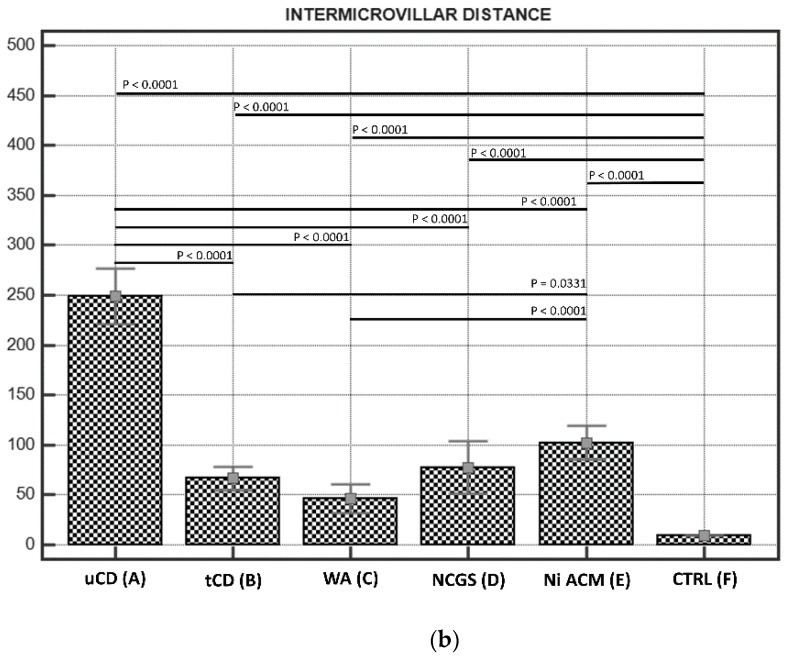
(a). Microvilli lengths in IBS-like disorders; the graph shows the lengths of microvilli (expressed in nm) in the IBS-like disorders studied with any significant differences: uCD; tCD; WA; NCGS; Ni ACM; controls. Persistent hypotrophic microvilli in uCD are not dissimilar to those of NCGS and Ni ACM. Microvilli in tCD appear significantly longer than in uCD, but significantly shorter than in controls. (b). Intermicrovillar distances in IBS-like disorders; The graph shows the intermicrovillar distances (expressed in nm) in the IBS-like disorders studied, with any significant differences: uCD; tCD; WA; NCGS; Ni ACM; controls. The most significant distances are observed in uCD; a significant recovery is observed in tCD, although the microvillar distance is smaller in the controls than in all the other groups. Similar intermediate intermicrovillar distances appear in NCGS and Ni ACM.


