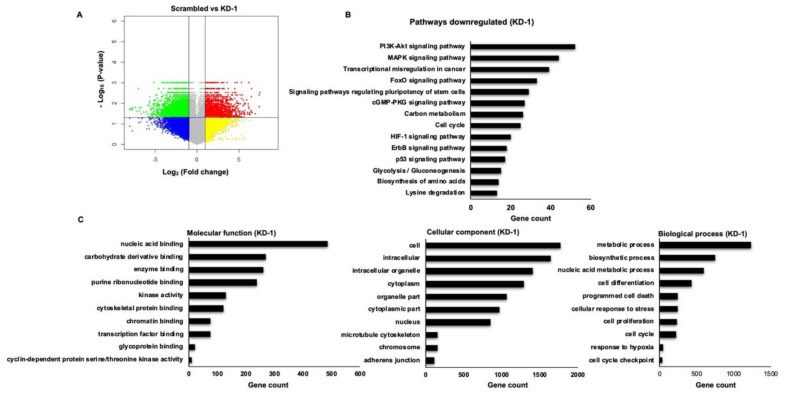
Figure 5.
Microarray analysis of differentially expressed genes (DEGs). (A) Volcano plot constructed using fold change and p-values to compare the gene expression changes between scrambled and MYCN knockdown (KD-1) Y79 cells. The green spots indicate significantly downregulated genes with log2 (fold change) < −1 and p-value < 0.05, and red spots represent the significantly upregulated genes with log2 (fold change) > 1 and p-value < 0.05. the yellow and blue spots indicate the non-significant changes in gene expression. (B) KEGG pathway enrichment analysis of downregulated DEGs upon MYCN knockdown. (C) GO functional enrichment analysis of downregulated DEGs in response to MYCN knockdown. GO terms are enriched into three subgroups: Molecular function, Cellular component and Biological process. KEGG: Kyoto Encyclopedia of Genes and Genomes, GO: Gene Ontology.

