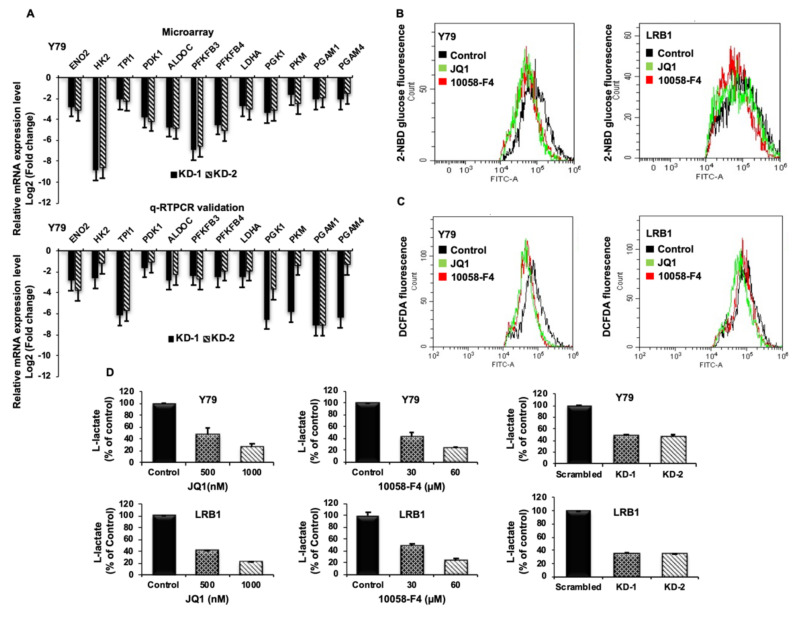
Figure 6.
The impact of MYCN inhibition on metabolic parameters in RB cells. (A) Top 12 downregulated differentially expressed metabolic genes identified by microarray data analysis (upper panel) and qRT-PCR validation of the identified DEGs (lower panel). (B,C) Decreased levels of glucose uptake and reactive oxygen species (ROS) were observed upon MYCN inhibition compared to the untreated control cells. (D) MYCN inhibition with small molecule inhibitors and shRNA knockdown led to decreased lactate levels in Y79 and LRB1 cells. The error bars represent standard error of mean.

