Figure 7.
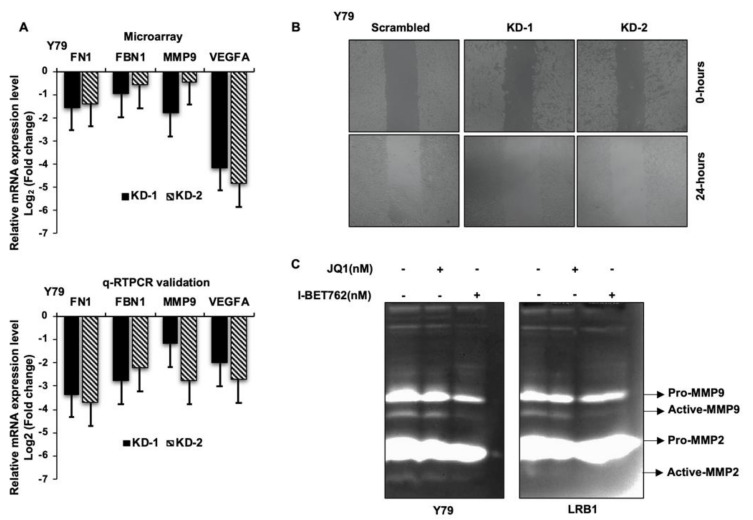
The effects of MYCN inhibition on cell migration in RB cells. (A) The bar graphs represent the top 4 downregulated genes involved in cellular migration and metastasis, upon MYCN knockdown in Y79 cells identified by microarray analysis (upper panel) and qRT-PCR validation of the identified genes (lower panel). (B) Reduced migration of cells was observed upon MYCN knockdown compared to the scrambled control cells. (C) Decreased gelatinolytic activity of active-MMP9 was observed in RB cells following MYCN inhibition. The error bars represent the standard error of mean.

