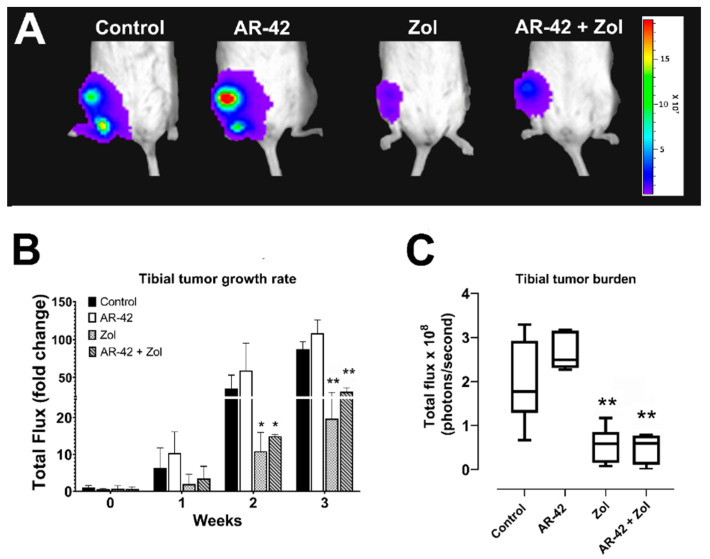
Figure 3.
(A) Representative bioluminescent images of MT-2-inoculated mice after treatment with AR-42, Zoledronic acid, combination, and vehicle (control) on the day of sacrifice. (B) Bar graph of weekly bioluminescence (fold change in photons/sec compared to control) measured in MT2 intratibial xenografts following treatment; data are represented by means ± standard deviation (SD). (C) Box and whisker plots of bioluminescence (photons/sec) measured on the day of sacrifice in treated vs. control mice. The median is indicated by the horizontal line inside the box, and the box encompasses the interquartile range (25–75th percentiles) while whiskers span 10–90th percentile of data. Significant differences between different groups and control are indicated as * p ≤ 0.05, ** p ≤ 0.01.

