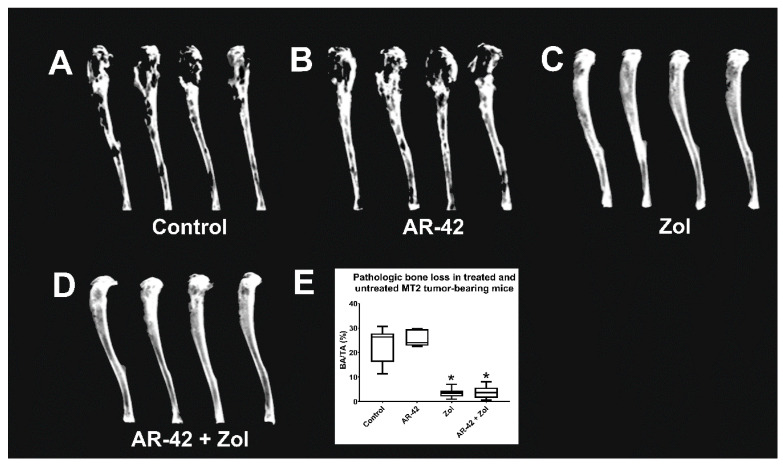
Figure 4.
(A–D) Radiographic images of MT-2-luc xenografted tibias of mice treated with either AR-42, Zoledronic acid, the combination, or vehicle. (E) Tumor-associated bone loss in treated and untreated MT-2-luc xenografted mice. BA = area of bone loss; TA = total tibial area; % BA/TA = percentage of area of bone loss per total tibial area. The box encompasses the interquartile range (25–75th percentiles), whereas whiskers span the 10–90th percentile of data. The median is denoted by the line within the box. Significant difference between different groups and control is indicated as * p ≤ 0.05.

