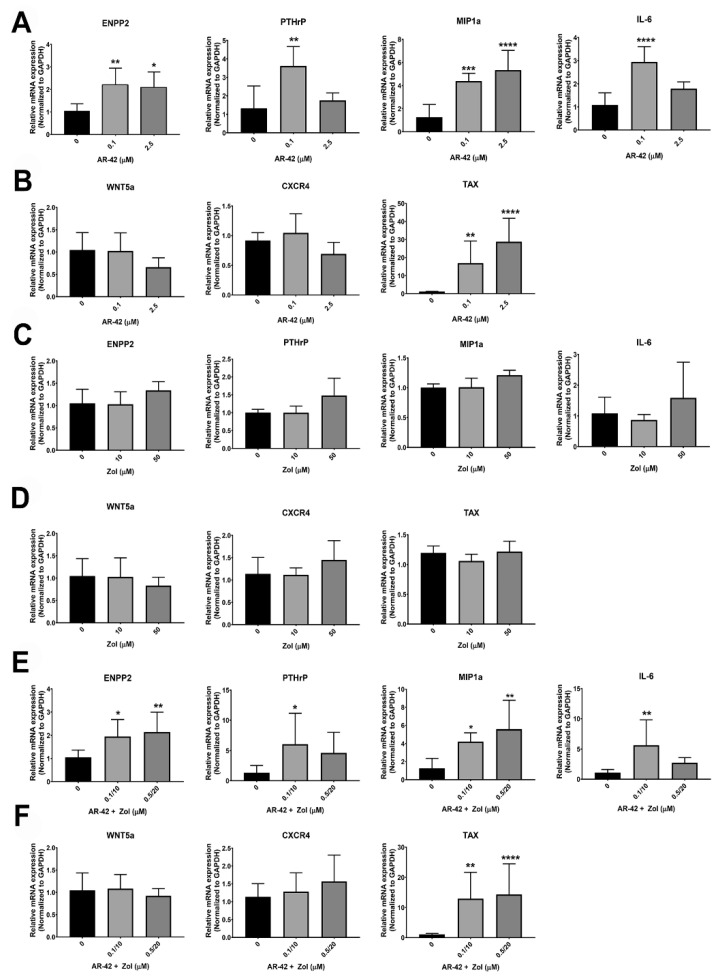
Figure 6.
The graphs represent the relative mRNA expression of ENPP2, PTHrP, MIP-1α, IL-6, WNT5a, CXCR4 and TAX genes in MT2 cells after treatment with either; (A,B) AR-42 (0, 0.1, 2.5 µM); (C,D) Zol acid (0, 10, 50 µM); (E,F) AR-42/Zol acid (0, 0.1/10, 0.5/20 µM in combination). Data are represented by means ± standard deviation (SD) and significant differences between control MT2 (0) and different treatments are indicated as: * p ≤ 0.05, ** p < 0.01, *** p < 0.001 and **** p < 0.0001.

