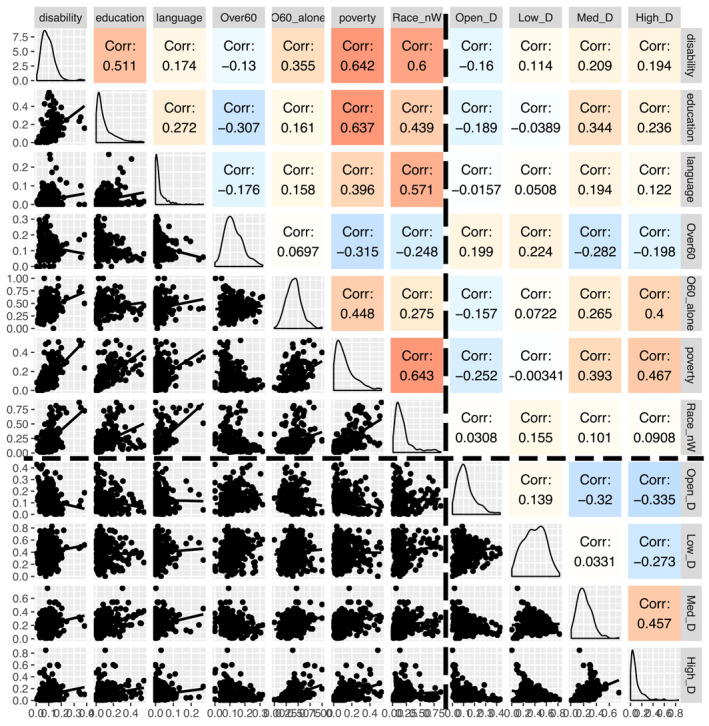
Figure 3.

Exploratory data plots for variables used in Heat Vulnerability Index analysis of Medium Metro tracts (n = 280). Below the diagonal show scatterplots of each variables. Above the diagonal presents the correlation values, and the density plots are on the diagonal. Top left box contains sociodemographic variables. Bottom‐right box contains considered environmental factors, and the other two box areas contain plots of socio‐demographic versus environmental variables.
