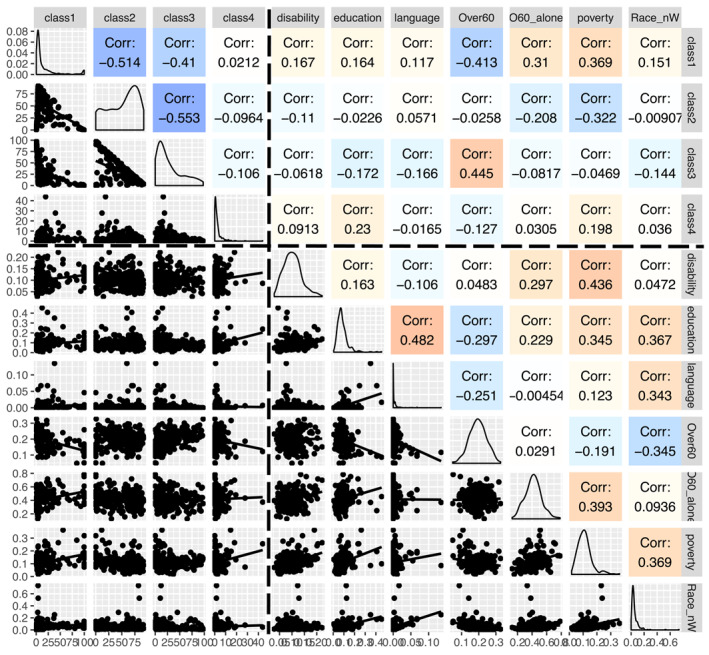
Figure 4.

Same as Figure 3, but for Non‐urban tracts (n = 252 tracts). Upper left boxes contain environmental variables, lower right boxes are socioeconomic variables, and the two other boxes contain information of socioeconomic‐environmental interactions.
