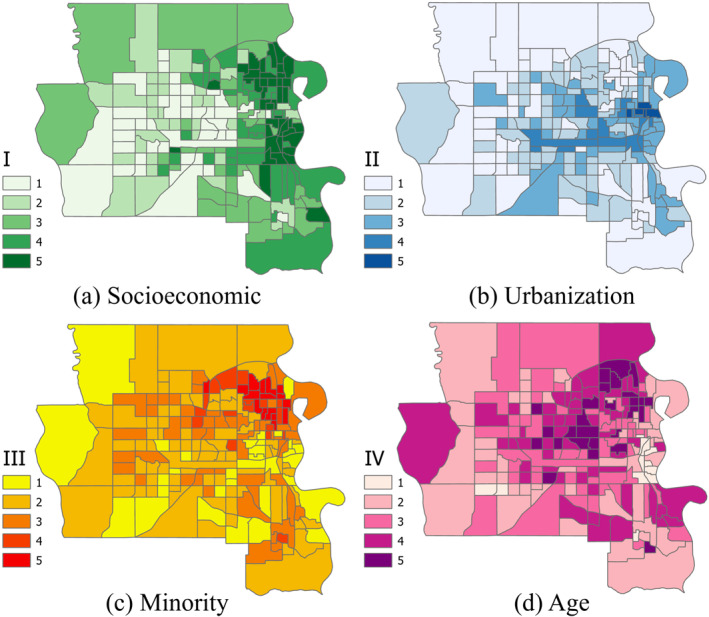
Figure 5.

Map of four vulnerability mappings of Omaha urban area as part of the Medium Metro classification (zoomed out of Figure 1a) (n = 196). Four factors of vulnerabilities are named based on the variables that highly participate in each factor loading (Table 3). Higher values represent higher vulnerabilities.
