Figure 10.

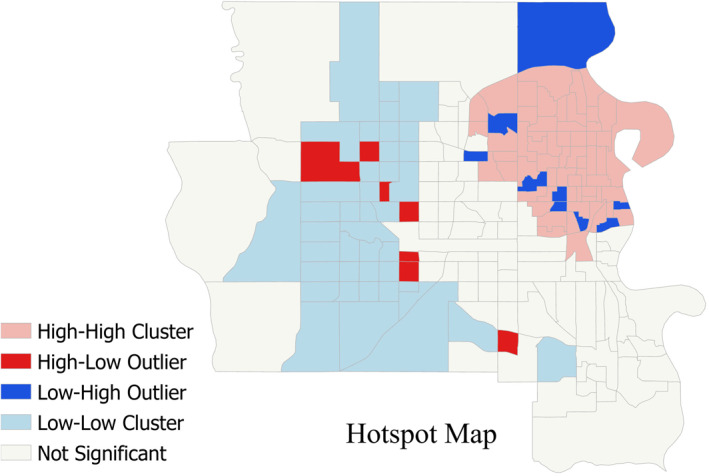
Cluster and Outlier analysis of Total Vulnerabilities for Omaha Area (zoomed from Figure 1a). In part (b) instead of Moran’s scatter plot include Rural areas.

Cluster and Outlier analysis of Total Vulnerabilities for Omaha Area (zoomed from Figure 1a). In part (b) instead of Moran’s scatter plot include Rural areas.