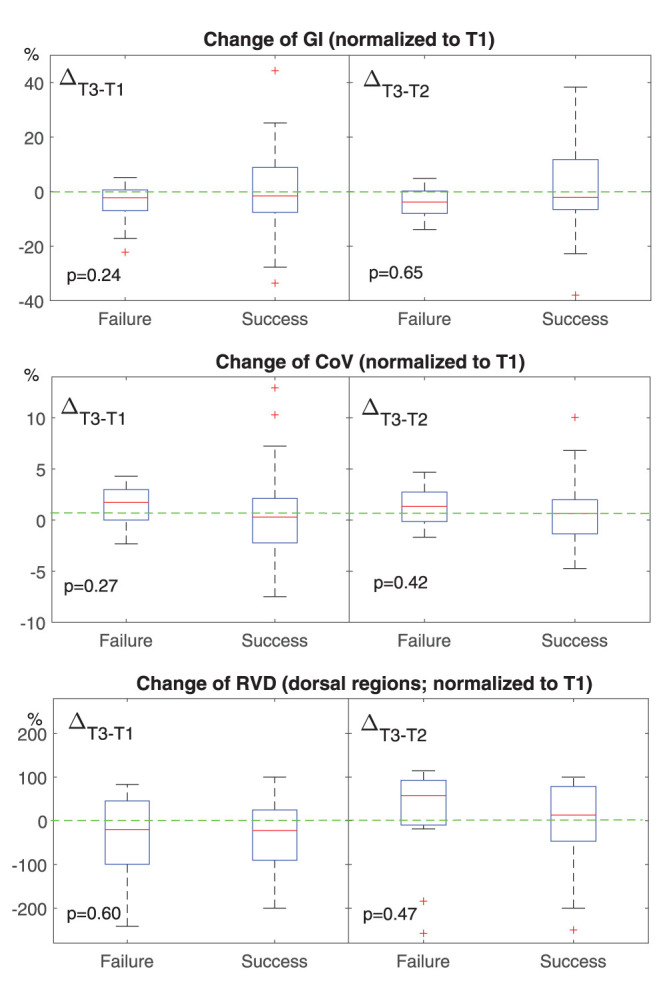
Figure 2.

Change of conventional EIT-based parameters at different time points. T1, before HFNC; T2, 30 min after HFNC started; T3, 1 h after HFNC started. All values were normalized to that at T1. The boxes mark the quartiles with median marked red, while the whiskers extend from the box out to the most extreme data value within 1.5* the interquartile range of the sample. The red crosses are outliers. Green dashed lines marked the value of 0. GI, the global inhomogeneity index. Lower than 0 means the ventilation becomes more homogeneous. CoV, the center of ventilation. Higher than 0 means that the ventilation distribution moves toward dorsal regions. RVD, regional ventilation delay. Higher than 0 means the delay is getting worse.
