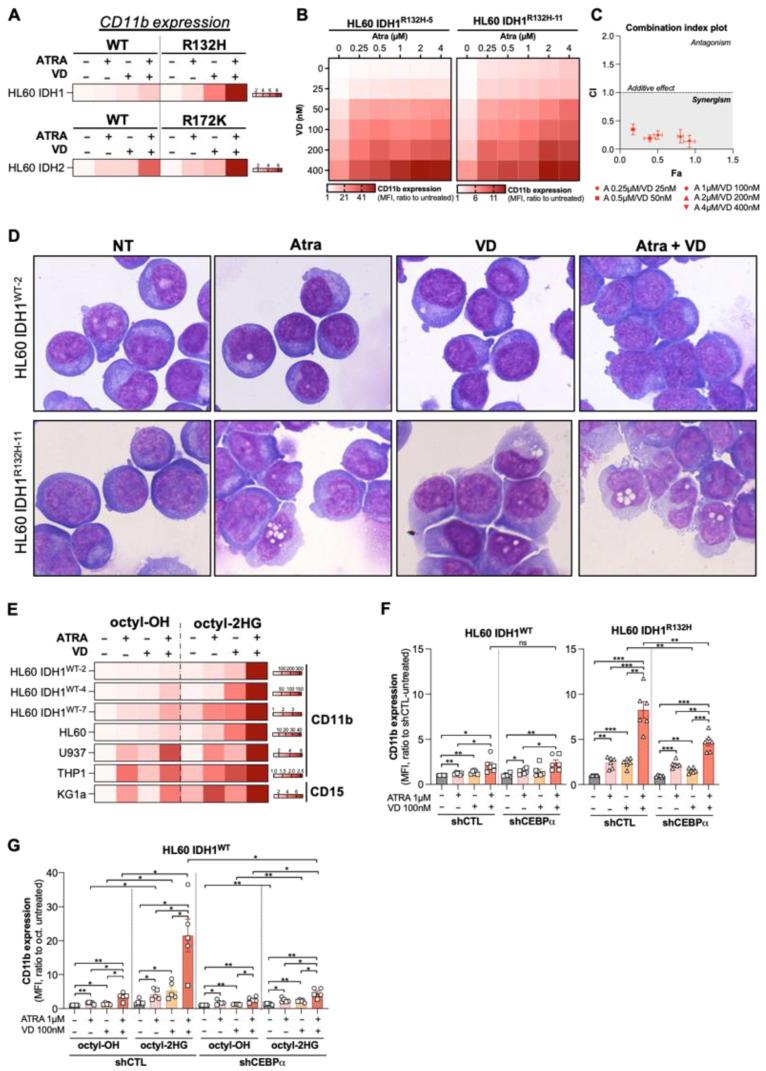
Figure 3.
Combine treatment with VD and ATRA produces a synergistic induction of differentiation in a CEBPα-dependent manner. (A) HeatMap of CD11b expression (MFI, ratio to untreated) measured by flow cytometry in HL60 IDH1WT versus HL60 IDH1R132H and HL60 IDH2WT versus HL60 IDH2R172K treated for 3 days with ATRA (1 µM) and VD (100 nM) alone or in combination. (B) Synergy Map of CD11b expression (MFI, ratio to untreated) measured by flow cytometry in HL60 IDH1R132H-5 (left) and in HL60 IDH1R132H-11 (right) treated for 3 days with 0.25–4 µM of ATRA and 25–400 nM of VD alone or in combination. (C) Combination index of differentiation (CD11b expression induction) in HL60 IDH1R132H-5 and in HL60 IDH1R132H-11 treated for 3 days with ATRA and VD in combination with constant ratio of each drug. (D) Morphological characterization by MGG staining of HL60 IDH1WT-2 versus HL60 IDH1R132H-11 treated for 5 days with ATRA 1 µM and VD 100 nM alone or in combination. (E) HeatMap of CD11b expression and CD15 expression (MFI, ratio to untreated) measured by flow cytometry in 2HG-treated (100(U937)-200 µM for 1wk) HL60 IDH1WT-2, HL60 IDH1WT-4, HL60 IDH1WT-7, HL60, U937, THP1 and KG1a treated for 3 days with ATRA (0.1 µM for U937, 1 µM for others) or VD (100 nM) alone or in combination. (F) CD11b expression (MFI) measured by flow cytometry in HL60 IDH1WT (clone 2: ○, clone 7: ☐) shCTL vs. shCEBPα (left panel) and in HL60 IDH1R132H (clone 5: ◇, clone 11: △) shCTL vs. shCEBPα (right panel) treated for 3 days with ATRA (1 µM) and VD (100 nM) alone or in combination. (G) CD11b expression (MFI) measured by flow cytometry in 2HG-treated HL60 IDH1WT (clone 2: ○, clone 7: ☐) shCTL vs. shCEBPα (2HG 200 µM for 3 days) treated for 3 days with ATRA (1 µM) and VD (100 nM) alone or in combination. * p < 0.05; ** p < 0.01, *** p < 0.005.

