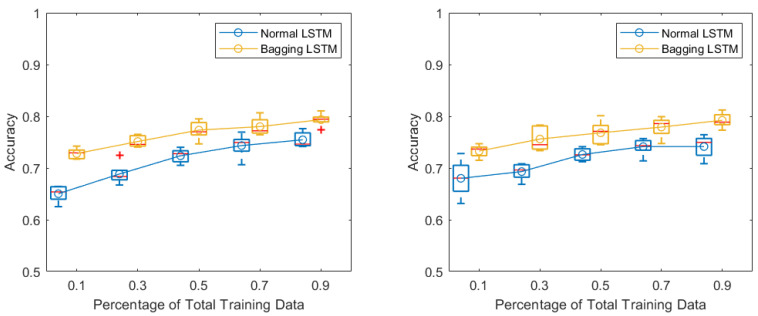
Figure 6.
(left) Accuracy of standard LSTM vs. bagging LSTM in the performed motor task. (right) Accuracy of standard LSTM vs. bagging LSTM in the imagined motor task, plotted as a function of the percentage of total training data. Boxplots of 5-fold cross-validation results with medians marked by red bars and boxes referring to and quartiles. The curves connect the means, marked by circles.

