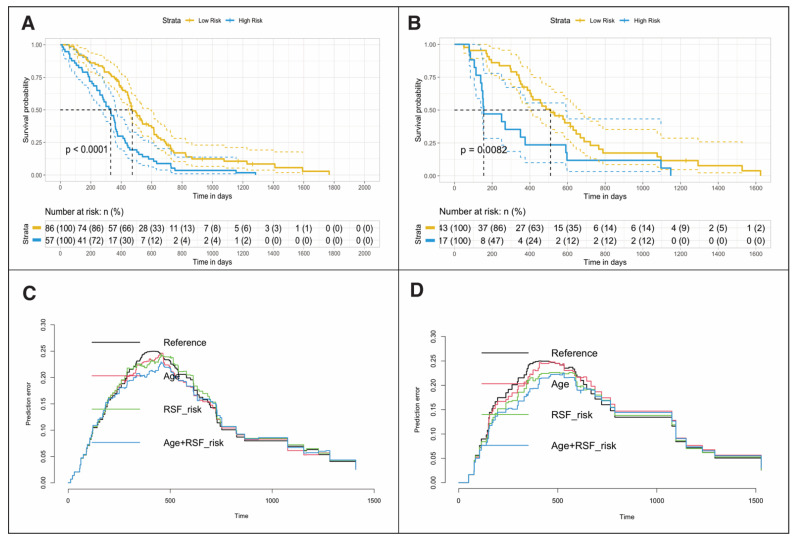
Figure 3.
Kaplan–Meier plots showing differences in overall survival for patients in training (A) and testing (B) data sets stratified into low- or high-risk groups by random survival forest (RSF)-based ensemble mortality. Prediction error curves show Cox regression model performance in the training (C) and testing (D) groups. HR= Hazard Ratio, RSF = Random Survival Forest, IBS = Integrated Brier Score, iAUC = Integrated area under the curve, 6m – AUC = six months - area under the curve.

