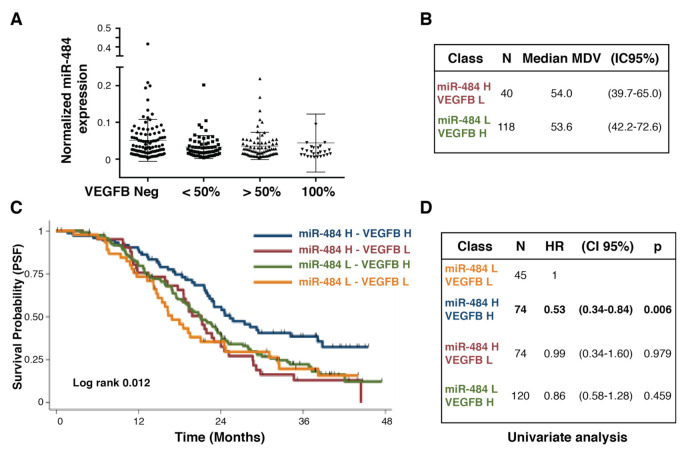
Figure 3.
Evaluation of the prognostic role of miR-484/VEGFB combined expression. (A). Dot plot reporting the expression of miR-484 in EOC samples divided based on the expression of VEGFB (Neg = negative samples; <50% samples expressing VEGFB in less than 50% of the cells; >50% samples expressing VEGFB in 50–90% of the cells. 100% samples with all (i.e., 90–100%) cells expressing VEGFB. (B). Evaluation of MVD (microvessel density) in samples expressing high levels of miR-484 (miR-484 H) and low levels of VEGFB (VEGFB L) or expressing low levels of miR-484 (miR-484 L) and high levels of VEGFB (VEGFB H) (C). Kaplan–Meier analysis evaluating the progression free survival of MITO16A-MANGO OV2 patients, divided based on the expression of VEGFB and miR-484. (D). Table reporting the univariate analysis of the different group analyzed in C. HR = hazard ratio. CI = confidence interval.

