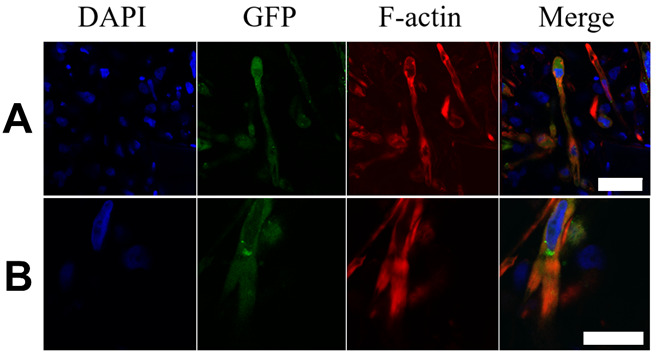
Figure 2.

hPSC-CM show distinct characteristics of maturation after 100 days in culture. The staining of 100-day-old hPSC-CMC shows the DAPI signal of the cell nuclei (blue), cTNT-GFP CM control (GFP, green), F-actin (Phalloidin-TRITC, red), and a merge of these channels. Exemplary CM with (A) multiple nuclei and (B) typical branching are shown. Scale bars: 50 µm (A), 25 µm (B).
