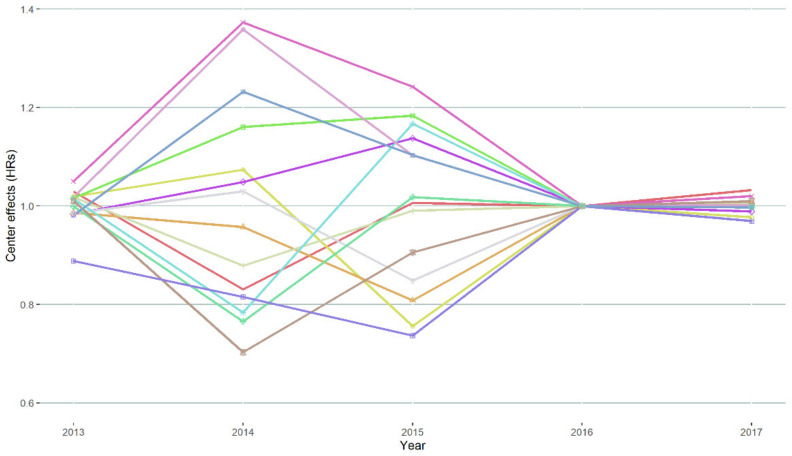
Figure 2.
HR for death until 2 years of each center between 2013 and 2017 in model III. Higher ratios mean that a center has a lower observed/expected ratio for 2-year survival corrected for gender, age at diagnosis, ECOG PS, LDH levels, number of organ sites, liver metastases, brain metastases, and BRAFV600 mutational status as covariates in a specific year of diagnosis. HRs = hazard ratios.

