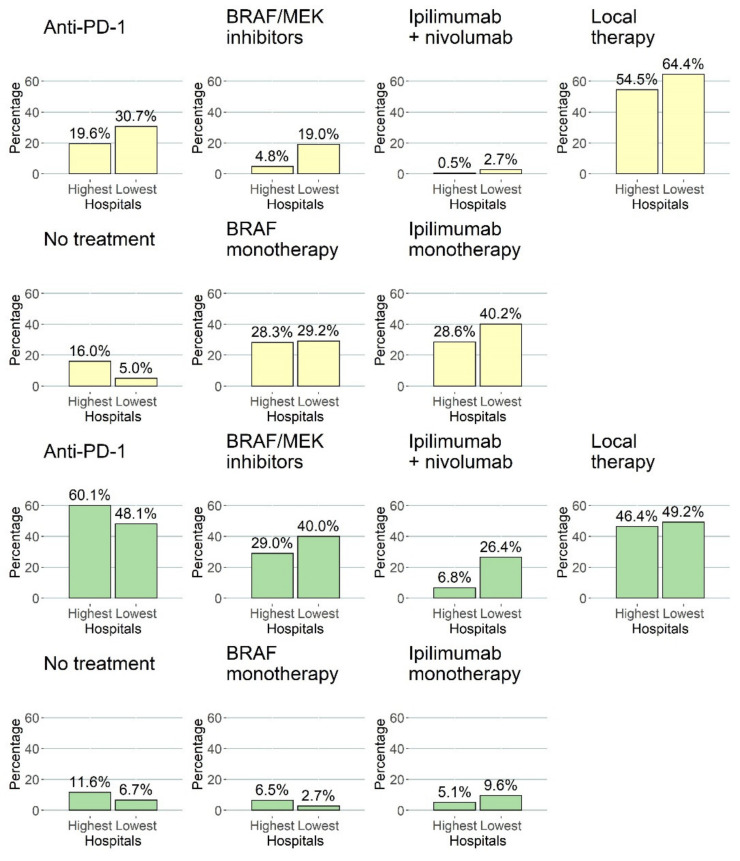
Figure 5.
Bar plots showing the percentage of patients with a specific systemic therapy somewhere in their treatment after diagnosis with advanced melanoma. Yellow bars represent patients diagnosed between 2013–2015, and the green bar plots show patients diagnosed between 2016 and 2017. Columns depicted by “highest” are the three centers with the highest HRs for 2-year survival, and “lowest” are the centers with the lowest HRs for 2-year survival.

