
Figure 2.
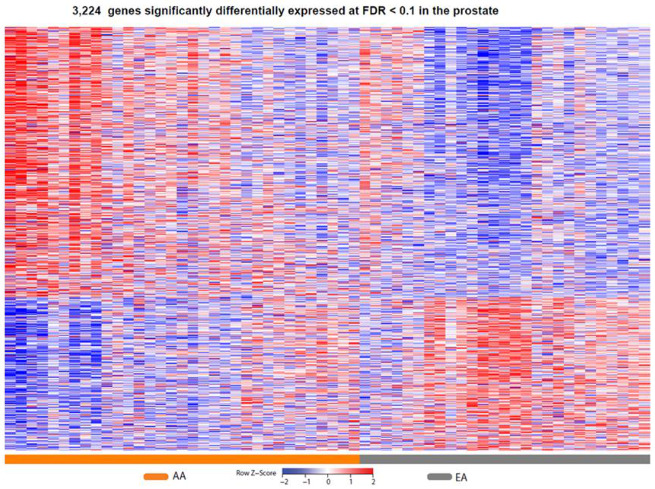
Heat map of gene expression changes by race. Red and blue boxes depict relative over- and under-expression with regard to a reference set as the mid-point between all patients. Only significant transcripts (q < 0.1) are shown. AA: African–American; EA: European–American.