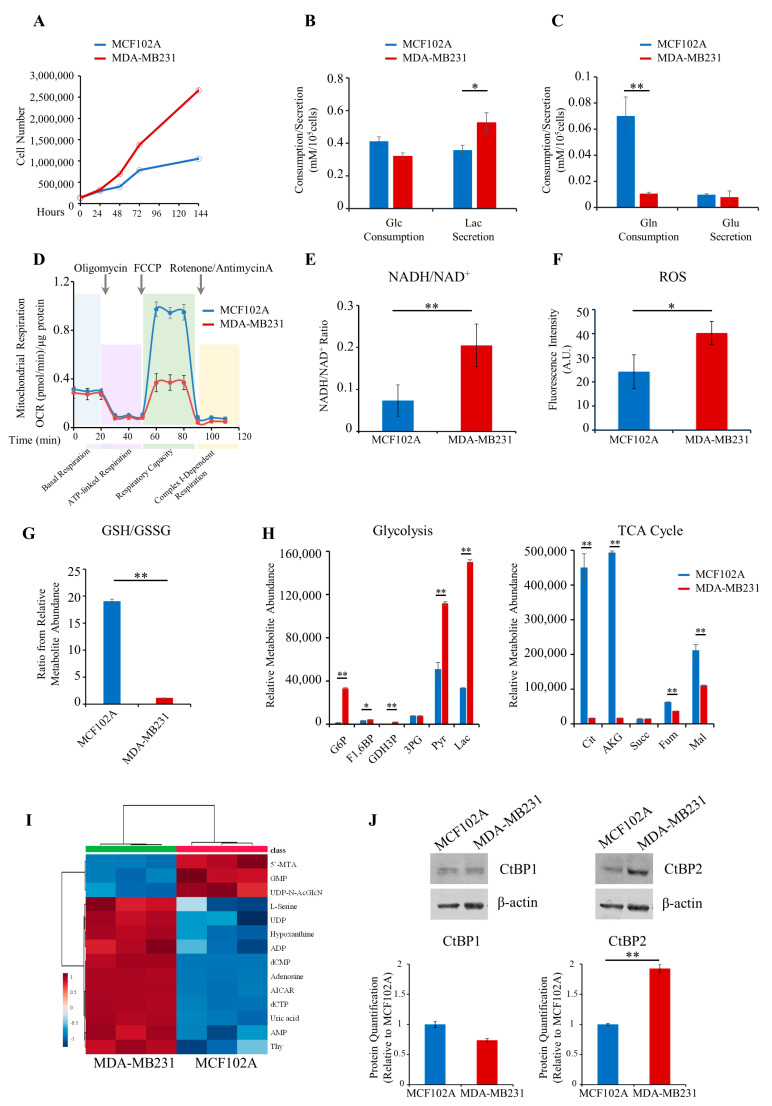
Figure 2.
Metabolic phenotype characterization of the MDA-MB231 triple-negative breast cancer cell line. (A) Proliferation curves of MCF102A (–) and MDA-MB231 (–) cells. Cells were grown in 6-well plates in the appropriate growth medium. Cells were collected and counted at the indicated time points. (B,C) Extracellular uptake of Glc/Gln and secretion of Lac/Glu in MCF102A (–) and MDA-MB231 (–) cells grown for 48 h determined enzymatically using YSI2950 bioanalyzer. (D) Mitochondrial respiration reflected by OCR levels in MCF102A (–) and MDA-MB231 (–) cells under basal conditions or following the addition of the indicated drugs (n = 5). (E) NADH/NAD+ ratio in MCF102A (–) and MDA-MB231 (–) cells obtained by colorimetric assay (n = 9). (F) Intracellular ROS levels in MCF102A (–) and MDA-MB231 (–) cells measured by DCFDA staining. (G) GSH/GSSG ratio in MCF102A (–) and MDA-MB231 (–) cells based on relative abundance obtained by LC-MS analysis. (H) Relative metabolites abundance of the glycolysis (left panel) and TCA cycle (right panel) pathways in MCF102A (–) and MDA-MB231 (–) cells. (I) Untargeted metabolic profiling of MDA-MB231 and MCF102A cell lines grown in standard growth conditions. Hierarchical clustering heatmaps, obtained by Metaboanalyst 5.0, show significantly different intracellular metabolites by LC-MS. (J) Representative images of the western blot analysis of MCF102A and MDA-MB231 reporting CtBP1, CtBP2, and β-actin expression (upper panels) (relative uncropped western blot and densitometry signals can be found in File S2A). Relative densitometry analyses of CtBP1 and CtBP2 expression in the MDA-MB231 cell line compared to MCF102A (lower panels). Error bars indicate SD (n = 3, unless otherwise noted). ** p-value < 0.005; * p-value < 0.01.

