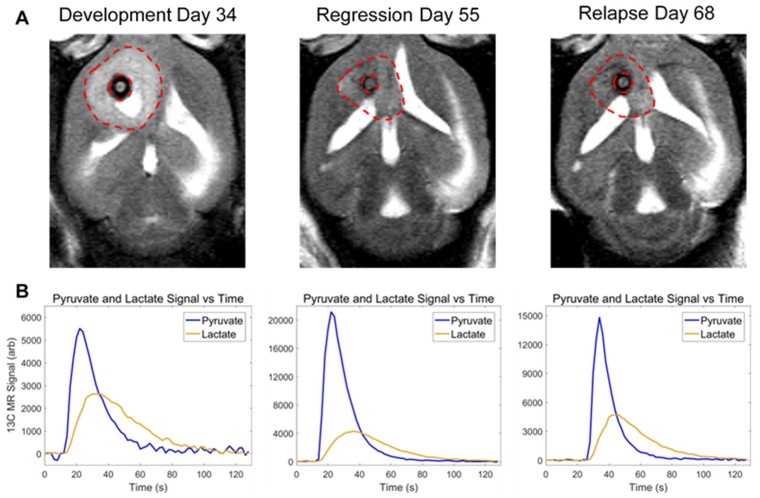
Figure 1.
Anatomic and metabolic imaging of tumor-bearing mice over time. Tumor volume (A), imaged with T2-weighted MRI, and pyruvate-to-lactate conversion (B), measured with hyperpolarized MRS, is displayed at the end of tumor development (Day 34), end of tumor regression (Day 55), and at the point of relapse (Day 68) in the same mouse.

