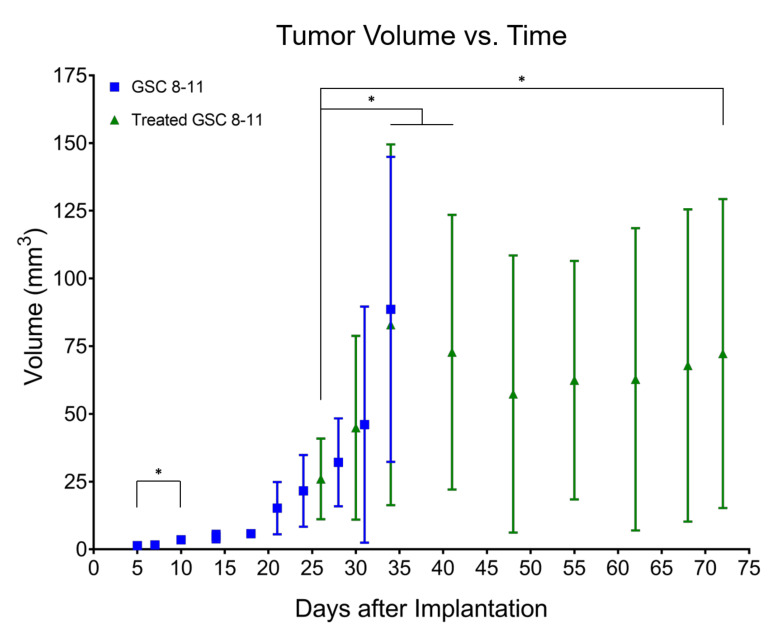
Figure 3.
Tumor volume increases during development but does not significantly change throughout regression or recurrence. Average tumor volume, measured from anatomic MRI, is plotted as a function of time in untreated (blue squares) and treated (green triangles) mice. Error bars represent standard deviation (not visible before Day 21 due to scale of Y-axis). These values were log-transformed to correct for heteroscedasticity and tested for significant differences using ordinary one-way ANOVA and follow-up Fisher’s Least Significant Differences tests. Comparisons that produced p < 0.05 were deemed significant. * p < 0.05.

