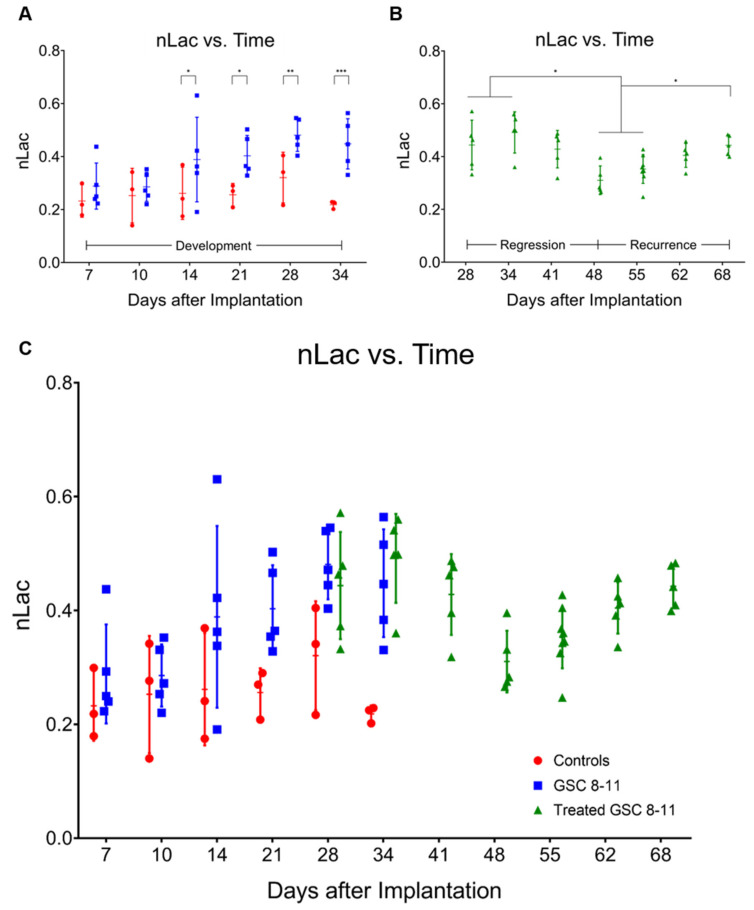
Figure 4.
In vivo pyruvate-to-lactate conversion is significantly altered throughout tumor development, regression, and recurrence. Individual nLac values, measured with hyperpolarized 13C MRS, are plotted as a function of time for control mice (red circles) and untreated tumor-bearing mice (blue squares) during tumor development (A). Individual nLac values are plotted as a function of time for treated tumor-bearing mice (green triangles) during tumor regression and recurrence (B). Individual nLac values are plotted as a function of time across the entirety of tumor progression (C). Error bars represent standard deviation. Average nLac values between groups and time-points were assessed for significance using ordinary one-way ANOVA and follow-up Fisher’s Least Significant Difference tests with significance attributed to comparisons that produced p < 0.05. * p < 0.05, ** p < 0.01, *** p < 0.001.

