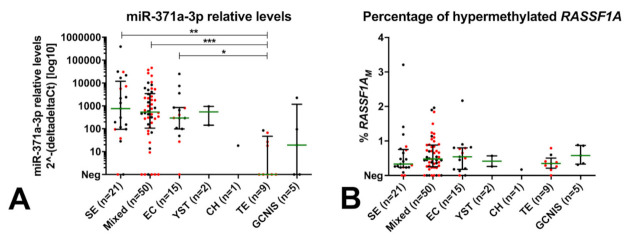
Figure 3.
Relative levels of miR-371a-3p (A) and percentage of RASSF1AM (B) across histological subtypes. Negative samples (as by the defined cutoffs) are plotted at the xx-axis (Neg). Stage I patients are highlighted in red. miR-371a-3p relative levels are normalized to miR-30b-5p and plotted in log10 format for readability. Bars represent median and interquartile range. * p < 0.05; ** p < 0.01; *** p < 0.001 (adjusted for multiple comparisons). Abbreviations: CH—choriocarcinoma; EC—embryonal carcinoma; GCNIS—germ cell neoplasia in situ; SE—seminoma; RASSF1AM—hypermethylated RASSF1A; TE—teratoma; YST—yolk sac tumor.

