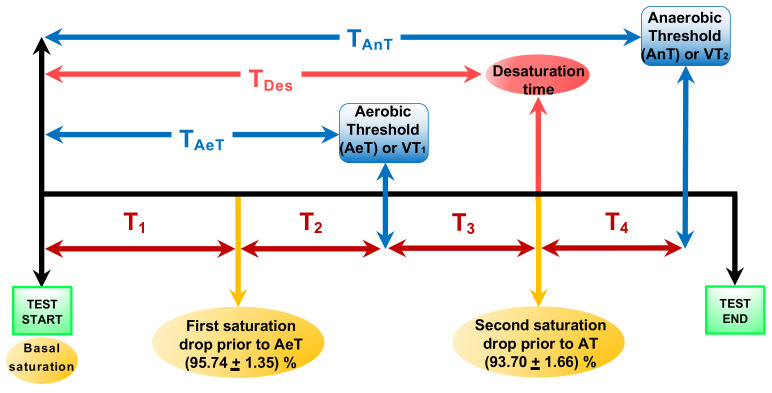
Figure 4.
Flowchart representing the different events during the effort test. The AeT and the AnT time are marked by blue arrows. The pink arrow corresponds to the maximum desaturation time after the AeT. The time to observe the first and the second drops are marked by the yellow arrows with the corresponding saturation values shown in the circles. The red arrows correspond to: as the time to observe the first drop value before AeT, as the time to reach the AeT from the first drop value, as the time to observe the second drop value after the AeT, and as the time from the second drop saturation to reach the AnT.

