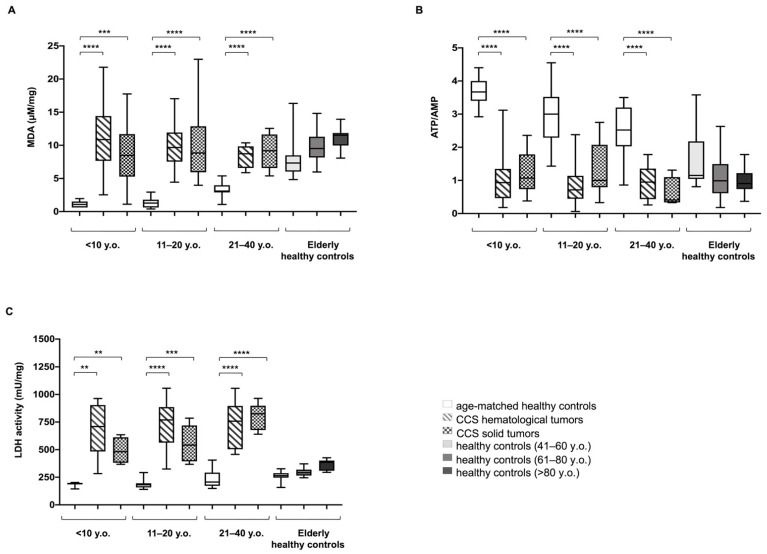
Figure 3.
Lipid peroxidation, energy status, and lactate dehydrogenase activity in MNCs isolated from CCS, and age-matched and elderly healthy controls. All data reported in this figure have been obtained using MNCs isolated from: age-matched healthy controls (<10 y.o. n = 17; 11–20 y.o. n = 18; 21–40 y.o. n = 24), CCS of hematological tumors (<10 y.o. n = 26; 11–20 y.o. n = 33; 21–40 y.o. n = 30), CCS of solid tumors (<10 y.o. n = 22; 11–20 y.o. n = 29; 21–40 y.o. n = 10), adult healthy controls (41–60 y.o. n = 21;.), and elderly healthy controls (61–80 y.o. n = 22 and >80 y.o. n = 25). (A) shows the cellular level of malondialdehyde (MDA), a marker of lipid peroxidation. Data are expressed as μM/mg of total protein. (B) reports the cellular energy status (ATP/AMP), evaluated as the ratio between the intracellular levels of ATP and AMP. (C) shows the activity of lactate dehydrogenase (LDH), the marker of lactate fermentation. Data are expressed as mU/mg of total protein. Statistical analysis was performed via non-parametric statistical approach (Mann–Whitney U test). **, ***, and **** indicate p-values of p < 0.01, 0.001, and 0.0001, respectively, between CCS samples and age-matched healthy controls. No significant differences were observed between CCS and adult and elderly controls (41–60, 61–80, and >80 y.o.).

